I'm pulling from my archive this week. Cartoons will be all about data visualization. …
Continue Reading about The Original Qualitative Visualization →
Dissemination that Actually Works
I'm pulling from my archive this week. Cartoons will be all about data visualization. …
Continue Reading about The Original Qualitative Visualization →
During this week's Thursday discussions over at diydatadesign we'll be talking about different strategies for visualizing survey data. Preparing for that call inspired this post. The …
Continue Reading about Serve up Survey Data with a Menu Infographic →
Just a guess here, but I don't think smart phones are going away anytime soon. I think it's time to really start focusing on how we can use the technology as a reporting tool. And stop pretending …
So who has time to read the small print? We are in an age where even large print is rarely read. Unfortunately there a lot of really good charts that require at least a little bit of …
From Edward Tufte's The Visual Display of Quantitative Information: A large share of ink on a graphic should present data-information, the ink changing as the data change. Data-ink is the …
Continue Reading about Why you shouldn’t decrease your data-ink ratio. →
I think we tend to undervalue Hans Rosling as a performer while hyping his data visualization. When you first watched his early *TED talks did you think, "Maybe I should create a bubble chart?" Or …
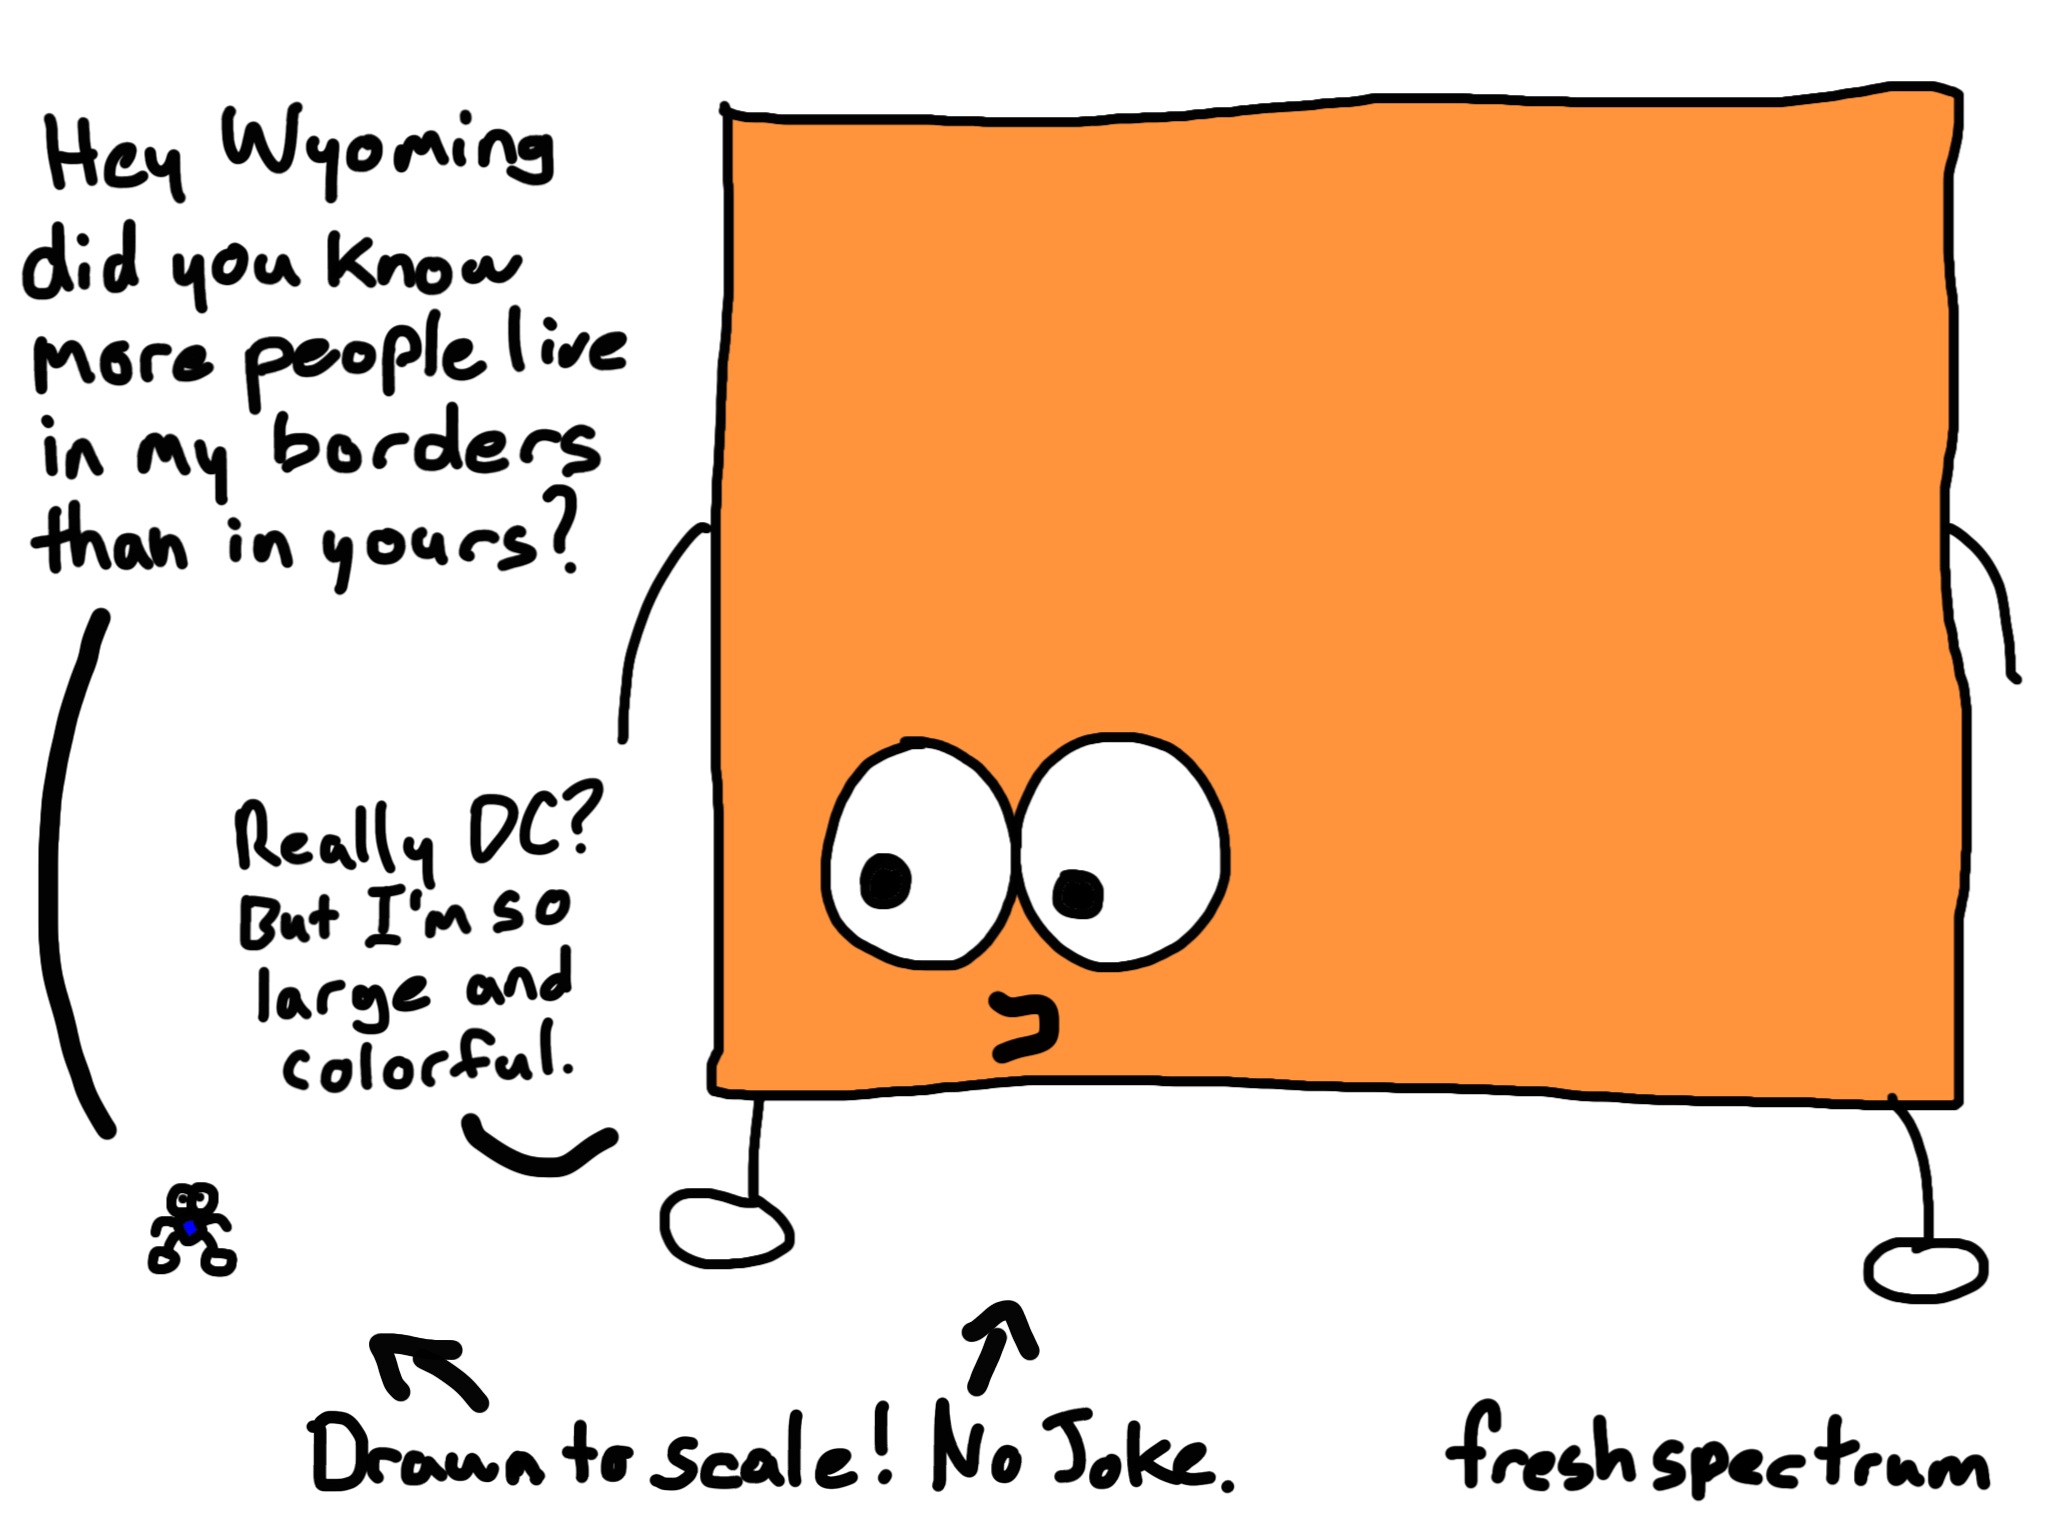
From Let’s Tesselate: Hexagons For Tile Grid Maps by Danny DeBelius of the npr visuals team: As the saying goes, nothing is certain in this life but death, taxes and requests for geographic data to …
Continue Reading about The big reason to stop coloring maps →
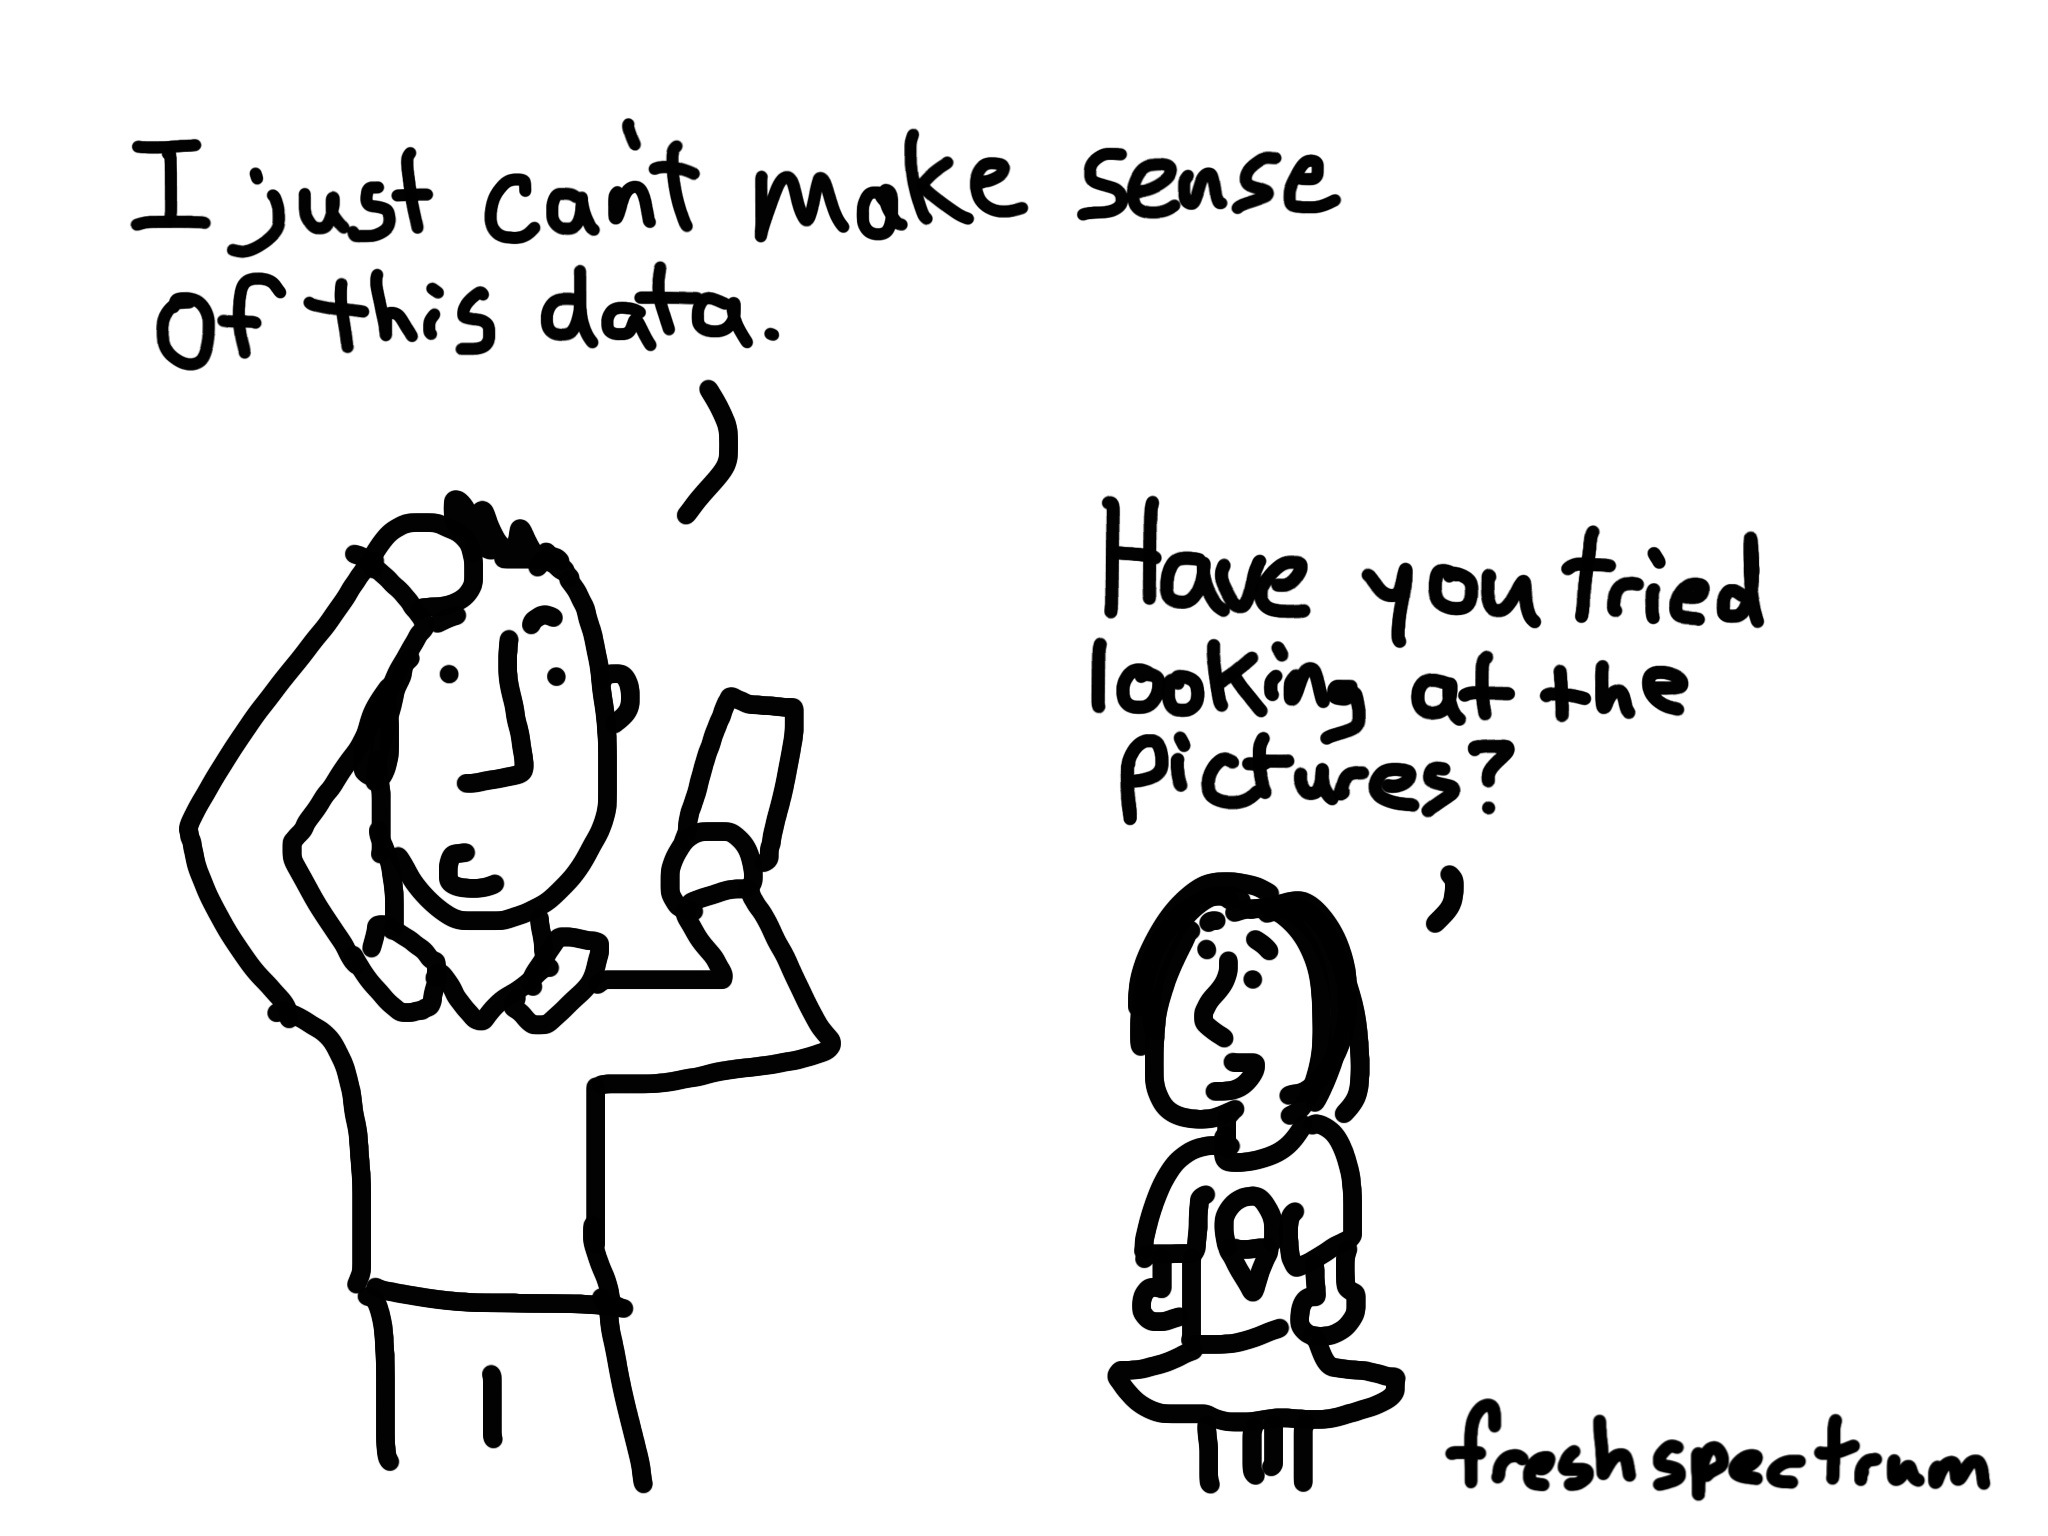
From Nathan Yau in his book Visualize This: Visualization One of the best ways to explore and try to understand a large dataset is with visualization. Place the numbers into a visual space and let …
Continue Reading about How pictures help you discover the unexpected. →
As a data designer and cartoonist, I have been heavily influenced by Scott McCloud's book on Understanding Comics. The cool thing about his book is that many of the concepts can be applied very …
Today's illustration was inspired by Ann K Emery's blog post on six alternatives to the clustered bar chart. We can all agree that 3-d exploding pie charts are pretty rotten. My vote for worst …
Continue Reading about What Ann K Emery really thinks about clustered bar charts. →
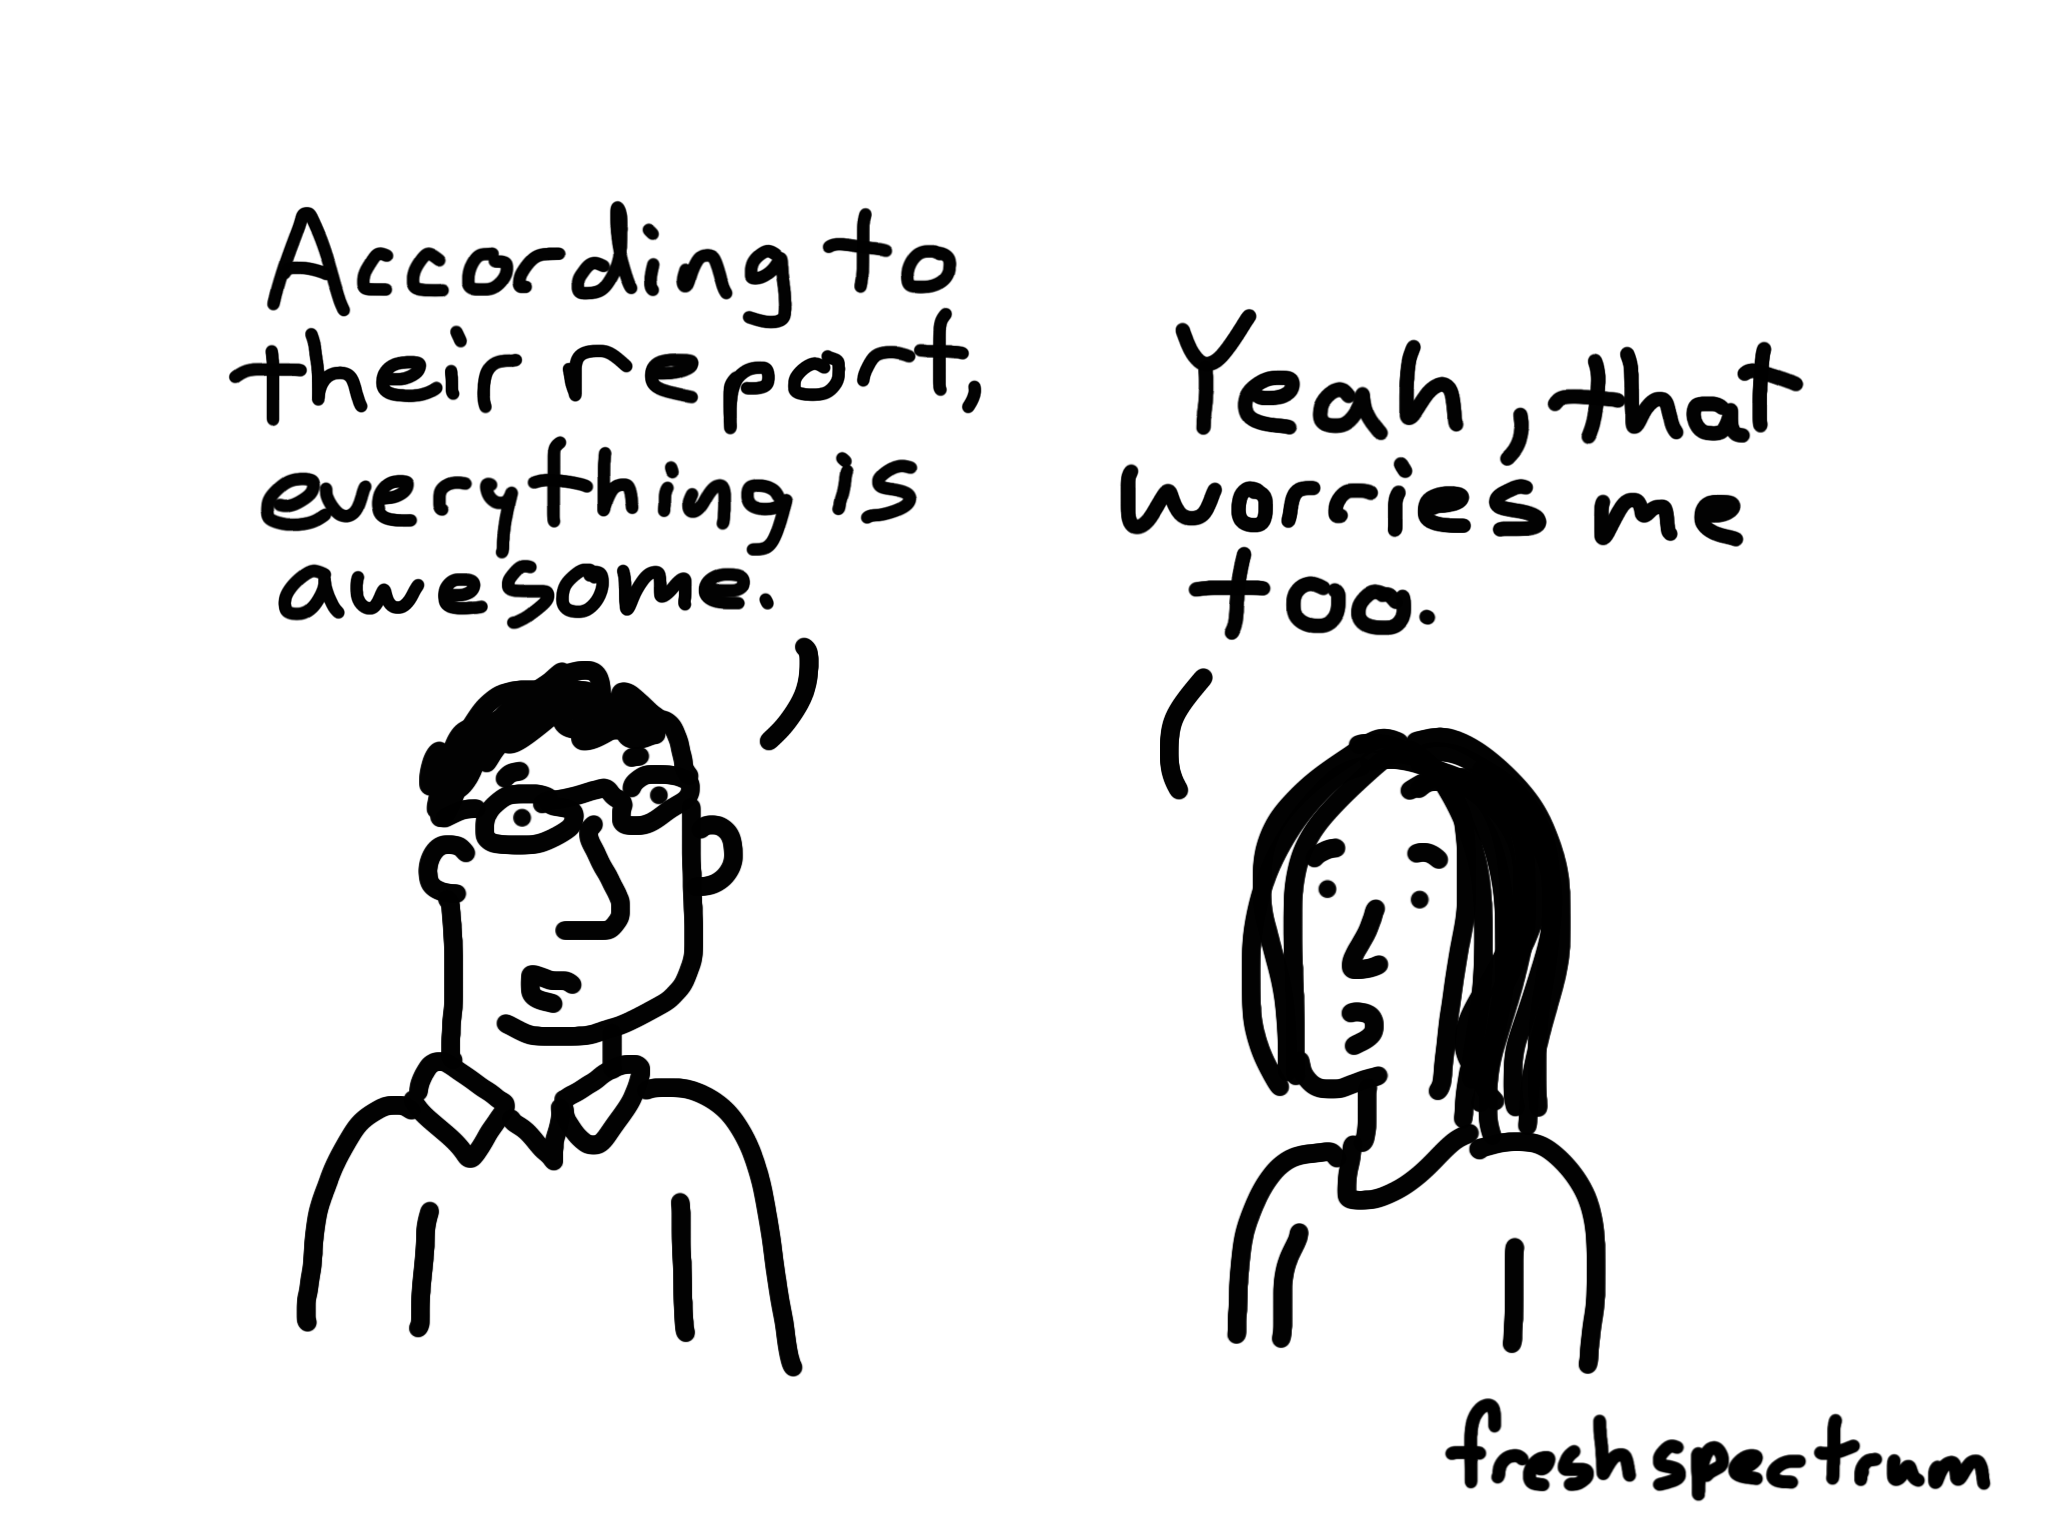
Today's illustration was inspired by an infographic created by the Overseas Development Institute. 5. 'Failures" are important. Evaluation is sometimes driven by desire to show that a …
Continue Reading about ODI shares 10 things to know about evaluation, number 5 is on failures. →
Today's cartoon flashback comes from a big Q&A post on blogging I pulled together a couple of years ago. Specifically from Nathan Yau's response when asked about his biggest blogging …
Continue Reading about Minimum Viable Explanation – cartoon flashback →