
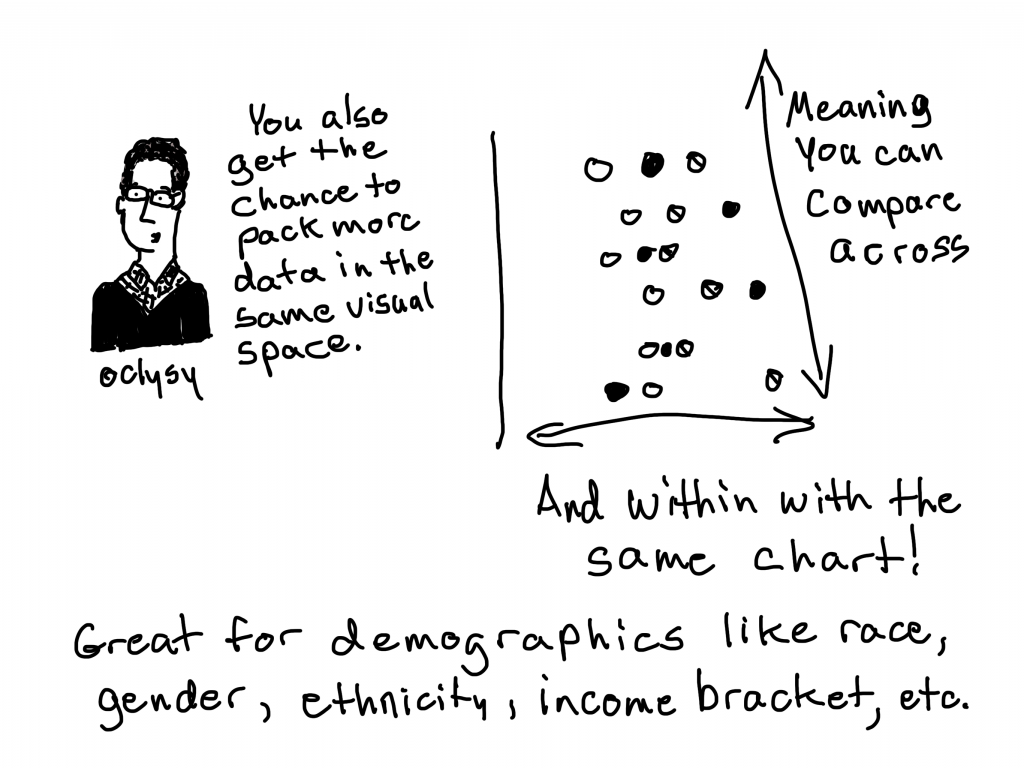
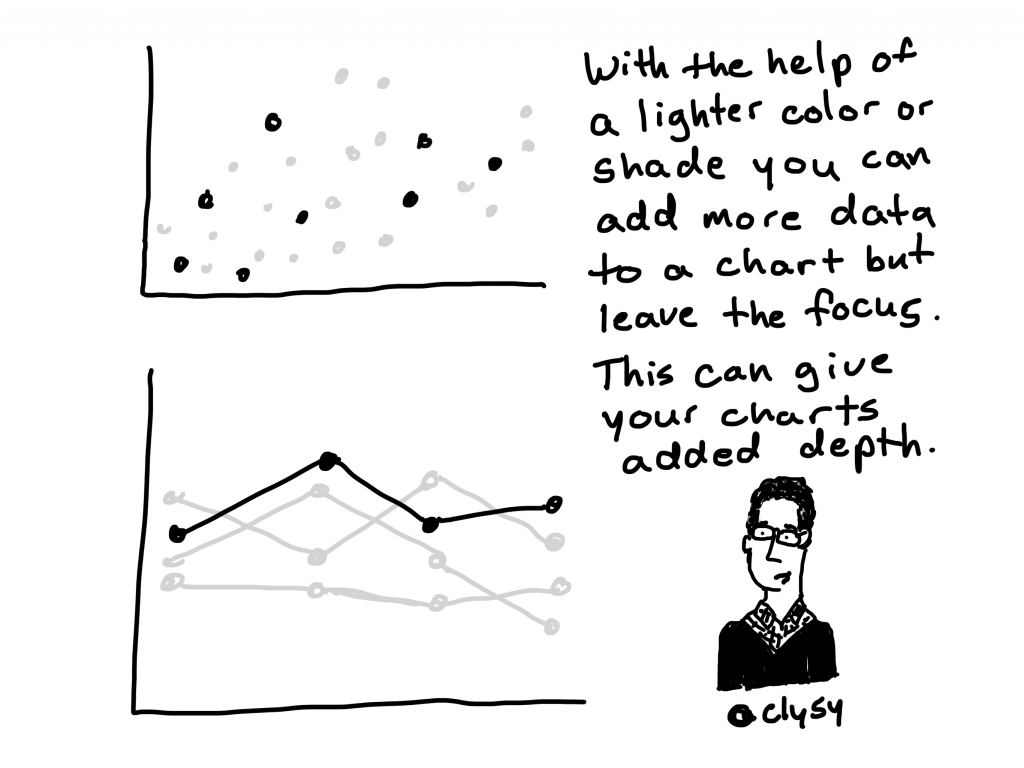
A bar chart and a scatter plot had a little baby. In this short graphic novel guide I’ll walk you through dot plots, why they exist, and how to use them.


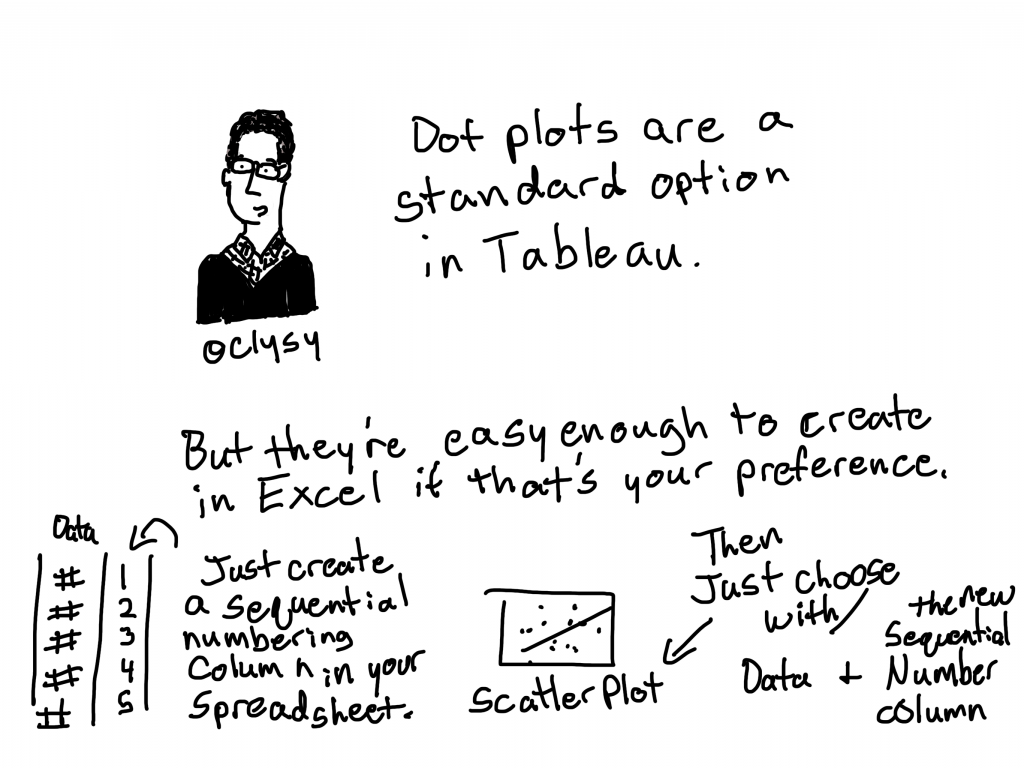

Want more step by step Excel instructions?
Stephanie has a couple of good guides:
Chris Lysy's Evaluation Blog
A bar chart and a scatter plot had a little baby. In this short graphic novel guide I’ll walk you through dot plots, why they exist, and how to use them.
Want more step by step Excel instructions?
Stephanie has a couple of good guides:
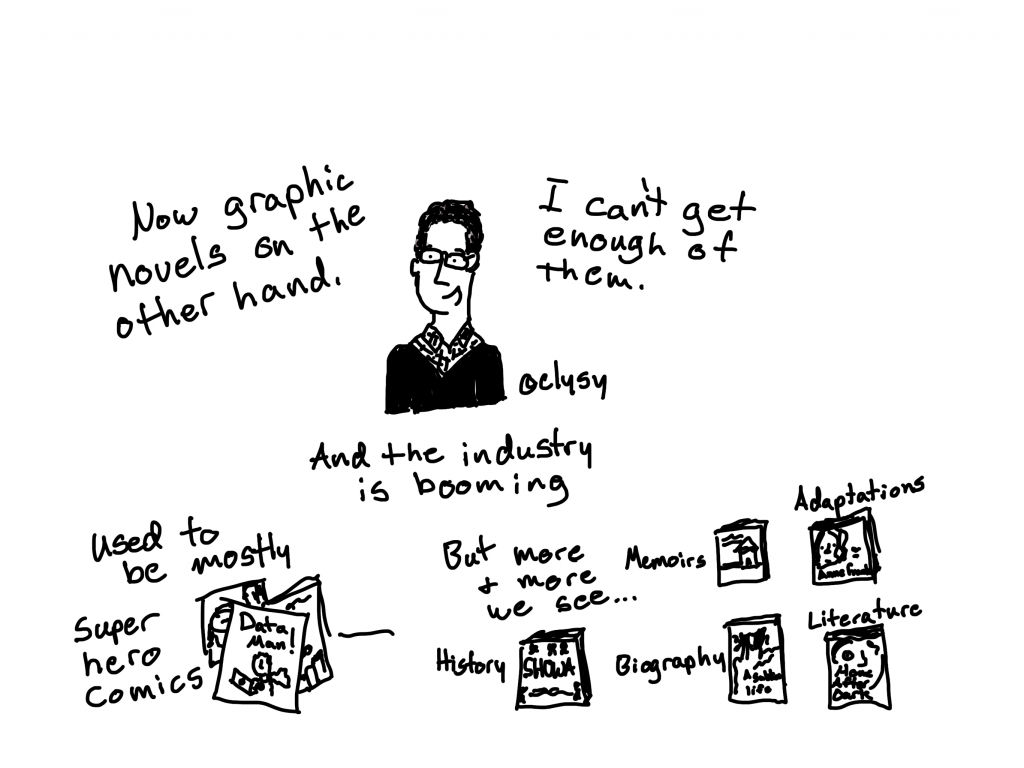
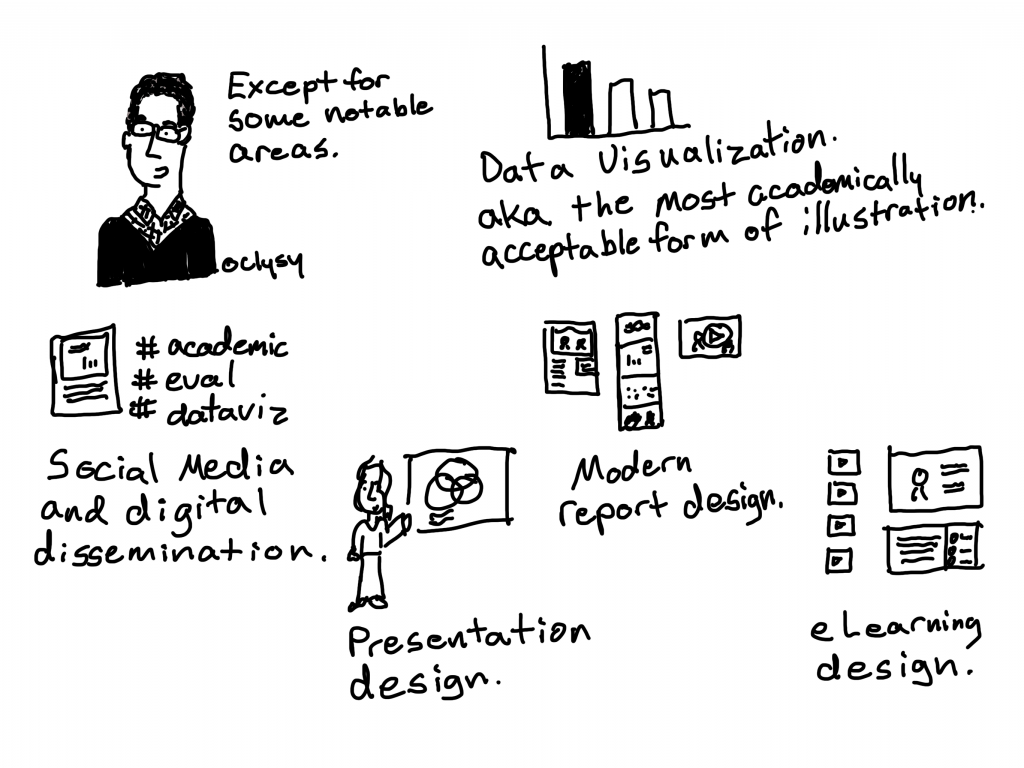
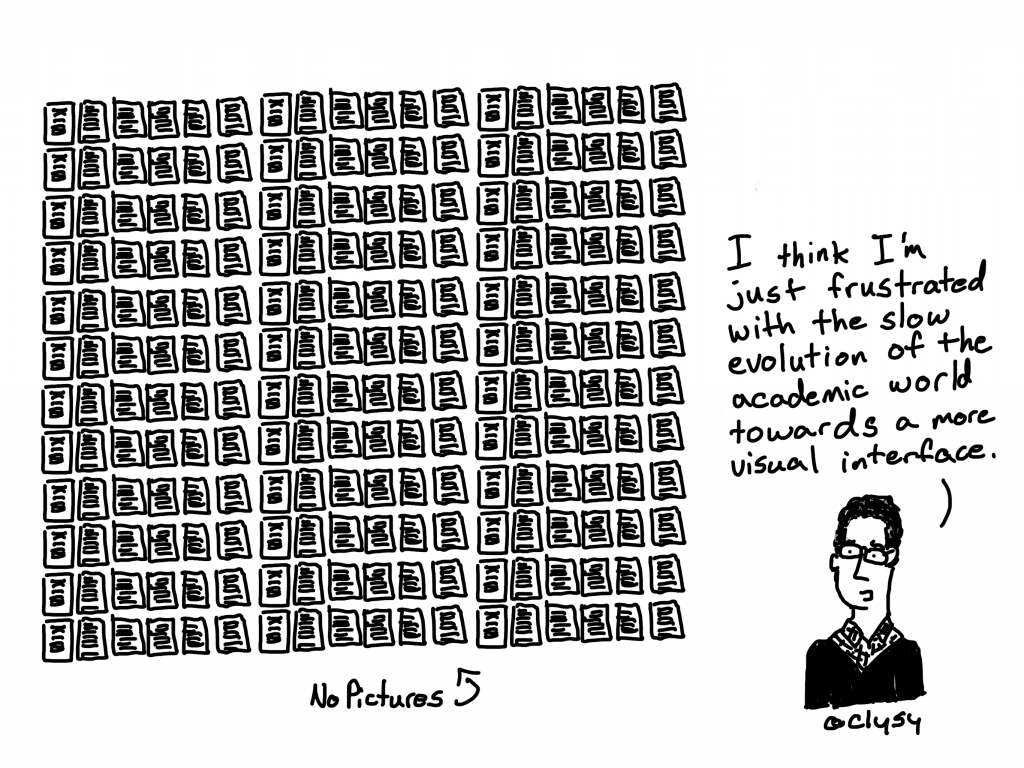
In today’s graphic novel blog post I talk about the underlying challenge that drives my work.


![And if we don't adapt and evolve, we create space for conmen to hijack the public trust.
[like Trump]](https://freshspectrum.com/wp-content/uploads/2019/12/Conmen-hijack-public-trust-1024x768.png)


If we chose clothing the way we chose charts, we would all look the same. How dull. My contention, there is no single right chart or wrong chart, that said, here is how I go about choosing.


So, if I were to create a bunch of these types of lessons and put them together into a graphic novel guide, would you buy it?

