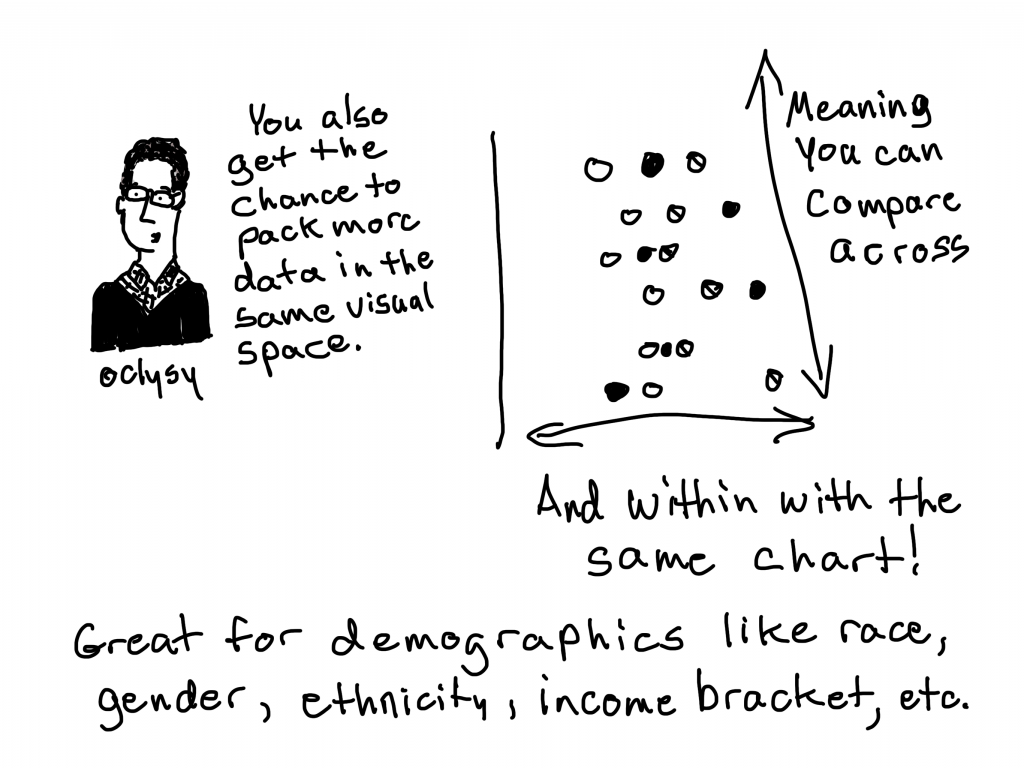
A bar chart and a scatter plot had a little baby. In this short graphic novel guide I’ll walk you through dot plots, why they exist, and how to use them.


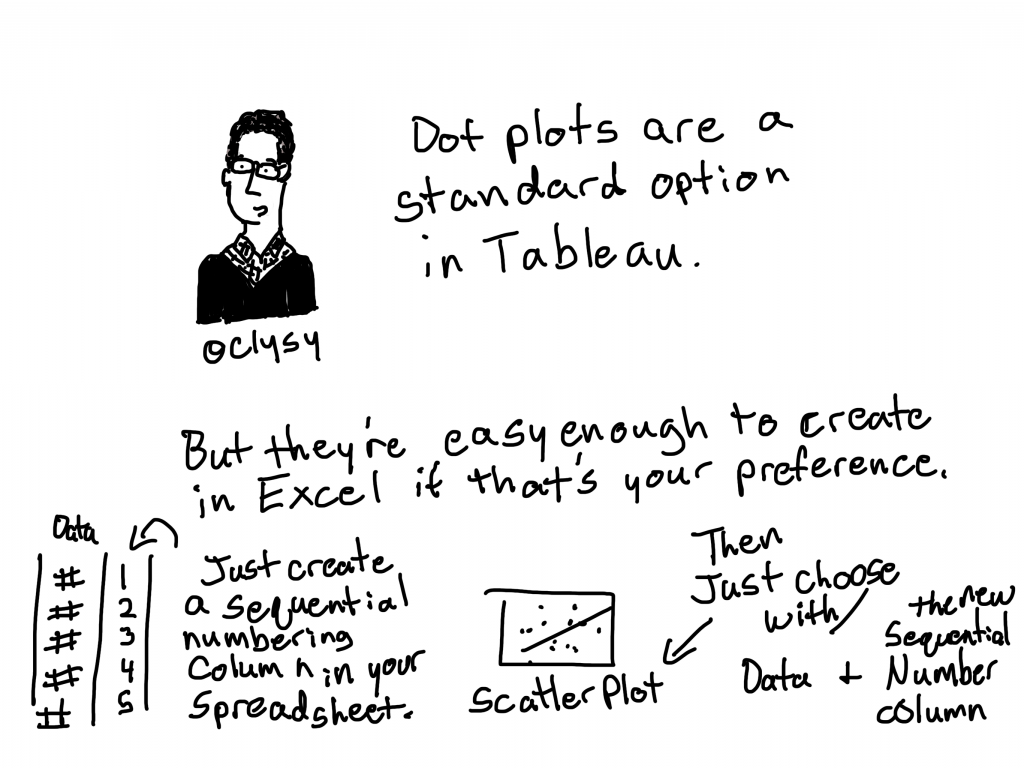

Want more step by step Excel instructions?
Stephanie has a couple of good guides:
Dissemination that Actually Works
![Chart Guide: Dot Plots [graphic novel blog post]](https://freshspectrum.com/wp-content/uploads/2019/12/dot-plots-chris-lysy-1200x385.png)
A bar chart and a scatter plot had a little baby. In this short graphic novel guide I’ll walk you through dot plots, why they exist, and how to use them.
Want more step by step Excel instructions?
Stephanie has a couple of good guides:
I love it!
Thanks Chris.
Thanks Rita 🙂
Very nice explanation and summary, and generous of you to share Stephanie’s links.
Thanks, Chris.