
A content roadmap is your overall strategy. It helps you systematically formulate your plan based on reaching your audience at just the right times.
Articles

Audience Profiles
Understanding your audience takes some research and thought, but it’s worth it. The product of those efforts, audience profiles, make everything else easier. From overall strategy to design and evaluation.

11 cartoons and posts you may have missed
So as promised, I’ve been focusing a lot of attention on building my creative workshop for data people. But while I haven’t posted here, I’ve still been cartooning. So I thought maybe once a month I would send give you a little summary post featuring some of my creative work from around the web. Many of […]

Gone Workshoppin’
So there’s this thing I gotta do. You know that whole creative workshop for data people thing that I started? I’ve come to the realization that if I want it to be successful, I need to give it everything I’ve got. So freshspectrum’s going to go quiet for a bit. Not sure for how long, […]

The secret sauce of an RSA Animate.
The secret to a great whiteboard animation is a fantastic talk. It’s not a way to make boring talks interesting, but rather make already great talks spreadable through a new channel. Check out some of Andrew Park’s work at Cognitive. When you do, think about how many of the talks really need the animation to […]
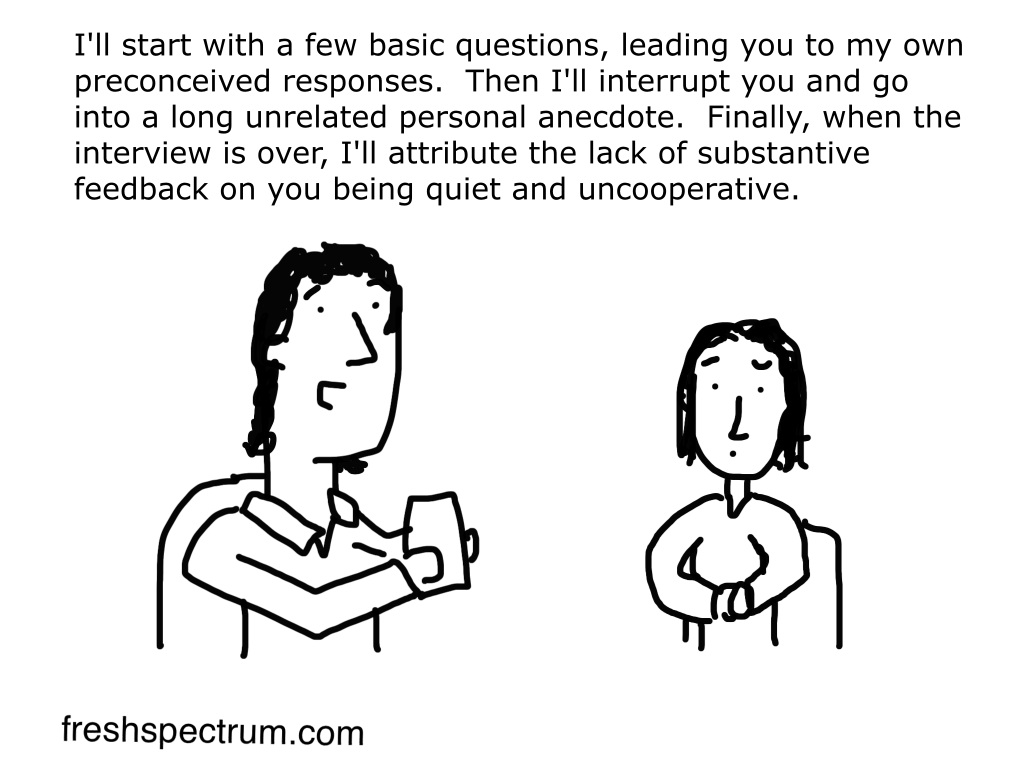
Don’t be a qualitative bully.
Today’s cartoon comes from a set I created for Michael Quinn Patton.