Never before in history have we had so many tools and channels we could use to deliver research and evaluation insights directly to people who could actually use them. And yet, most organizations still rely on outdated and ineffective dissemination strategies.
Now it’s easy to bash the organizations, but the truth is that our research and evaluation frameworks rarely do more than pay lip service to dissemination and reporting.
We can do better. This Theory of Use is my attempt to fill the gap.
In this post:
- Starting with Insights not Reports
- Building a Simple Theory of Use (Insight, Audience, Outcome)
- Step 1. Identify Your Insights
- Step 2. Consider Your Audiences
- Step 3. Determine Your Mechanisms
- Step 4. Putting the Theory of Use pieces together.
- Revisions Made (Last Updated June 15, 2026)
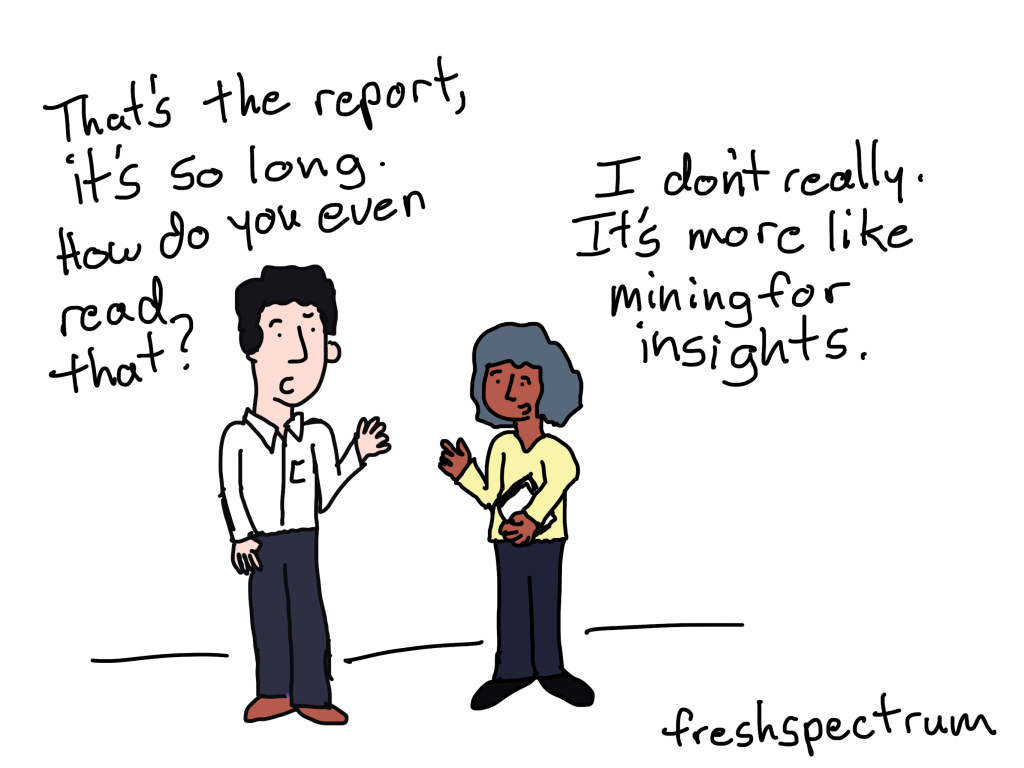
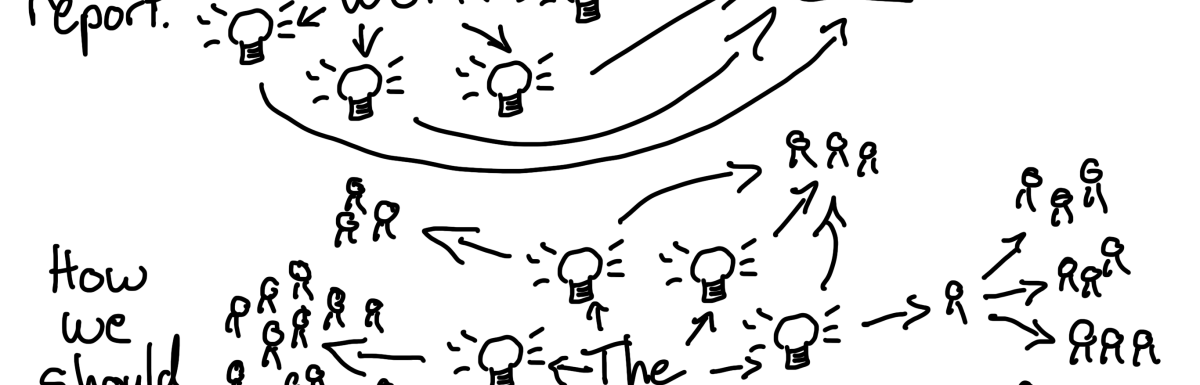
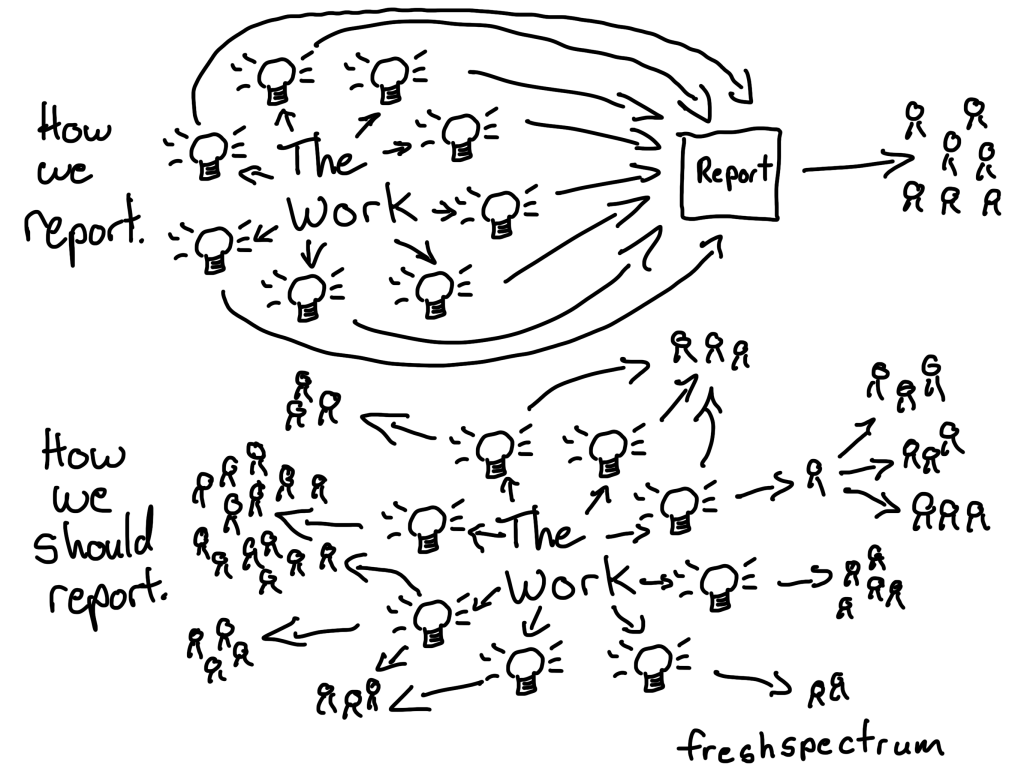
Starting with Insights, not Reports.
In research and evaluation we tend to treat reports as if they are the singular end-products of our work. A product that packages all of our questions, methods, findings, and recommendations together so that they can then be distributed.
In other words, the report has become a proxy for our work.
You’ll see this in all sorts of textbooks, guides, and frameworks. The report is the culmination of our efforts, and the thing to be shared.
This might have been useful at a time when publishing was paper and reaching others required travel or postage. But now-a-days publishing can be an email, a YouTube video, a LinkedIn post… you get the idea. We don’t have to wait until we have all our ideas bundled together before sharing them with the people who need them. And even if we do want to wait, bundling everything together makes it harder to effectively share our work with others through modern channels.
As such, using the report as a proxy for our work holds us back from making an actual impact.
So I want you to change your mindset. The report is not the product of our work. Insights are the product of our work. And insights are generated throughout the research and evaluation process.
By focusing on insights, our reporting and dissemination process is fundamentally altered. With that in mind, we just need an approach to take these insights and turn them into outcomes. And that’s what I call my Theory of Use.
Building a Simple Theory of Use (Insight, Audience, Outcome)
My Theory of Use is built with three parts.
| 1. Insight | 2. Audience | 3. Mechanisms |
|---|
Step 1. Identify Your Insights
Think about the importance of research and evaluation questions. They center our work and allow us to choose appropriate methods. Because we know the specific questions that need answering it’s easy to identify where our methods and tools are lacking.
Questions are the atomic unit of evaluation/research design.
In much the same way, insights are the atomic unit of evaluation/research dissemination. If we understand the insights our work has produced, then everything about reporting becomes easier.
So your goal, before you can even think about what dissemination products to choose, is to identify insights. Whether you already have a final technical report or are just starting a new project, here are some places to look for good insights to share.
1. Primary Findings
What the evaluation or research was specifically designed to discover. The answers to the evaluation or research questions.
2. Recommendations
Actionable guidance derived from the findings. Usually directed at the client but potentially relevant to other audiences too.
3. Secondary Findings
Things discovered that weren’t the focus of the original questions but emerged from the data. These can be significant but are rarely disseminated properly.
4. Surprising Findings
Results that contradicted expectations, assumptions, or conventional wisdom. Frequently the most interesting and field-shifting insights. They can be buried because they’re uncomfortable.
5. Negative Findings
What didn’t work, what had no effect, what made things worse. Enormously valuable to the field. Systematically underdisseminated due to client pressure and publication bias.
6. Process Insights
What was learned about how the evaluation or research was conducted. Valuable to organizations building evaluation capacity and to evaluators designing future studies.
7. Methodological Insights
Innovations, adaptations, or lessons about what methods work in what contexts, with what populations, under what conditions. Critical for peers. Almost always buried in methods sections nobody reads.
8. Contextual Insights
What was learned about the setting, community, or system that wasn’t directly about the program or research question but matters for understanding the findings or designing future work.
9. Unknown
What the data contains that hasn’t been fully explored yet. Released for transparency or future discovery.
10. Research/Evaluation Questions [Pre-Insight]
Early in the project I’d just suggest flipping insights to research/evaluation questions. Then over time, as you discover things, you get to start adding insights or shifting the questions to answers.
Step 2. Consider Your Audiences
Insight quality is dependent on the audience. Just like one man’s trash is another man’s treasure, one audience’s insight is another audience’s boring block of text. To keep things simpler I like to use a five audience framework, but you can always get more specific if you have the time.
Audience 1. Client
Every project has someone holding the purse strings — a funder, a boss, a commissioner. They need accountability, completeness, and defensibility. They are almost always your primary audience by default, even if you pretend otherwise.
Audience 2. Community
The people closest to the work — research participants, program staff, partner organizations, community members whose lives and experiences generated your findings. They have a claim on the work that no other audience does, but they’re often the least served.
Audience 3. Influencers
Community leaders, policymakers, decision-makers — the people who could actually act on your findings. They’re busy, skeptical, and driven by decisions they’re already trying to make.
Audience 4. Peers
Other researchers, evaluators, and practitioners doing work like yours. Sharing with this audience contributes to a body of knowledge that makes everyone’s work better.
Audience 5. Public
The broadest and most uncertain audience. Not every project warrants a public audience — and pretending otherwise wastes effort and oversells findings. But when your work genuinely affects people’s lives, this audience deserves a real strategy.
Step 3. Determine Your Mechanisms
In order to connect your insights with your audiences you need mechanisms. Mechanisms can be all sorts of things from conversations and handouts to webinars and email newsletters. Often there are multiple mechanisms in sharing any single insight with your audience. For instance, you might share an insight inside a blog post but also share the link to that blog post through a direct message with a social media account.
If there is no existing mechanism that will connect your insights with your audiences, there can be no use. Reach alone is not sufficient for sharing insights, but it is necessary. And thinking through how you will reach your audience is a good place to start. Here are some of the many mechanisms you can use.
1. Conversation
A direct conversation with a member of your audience. This is usually the first way insights might spread inside of organizations and with direct clients or bosses.
2. Direct Email
Sending someone a direct email with the insight.
3. Email Newsletter
Sending a wider group of people an insight through email.
4. PDF/Word Report
These don’t share on their own, but the existence of a source does make sharing easier.
5. Blog Post
Blog posts can be long-form (pulling together multiple insights for a specific audience) or they can be short-form (talking about one specific insight).
6. Resource Library
A status quo way to share reports, but usually not very effective on its own.
7. Interactive HTML Report
A web-based report with a single page (or collection of pages).
8. Presentation
Maybe in a board room, at a conference, or just in your office.
9. Webinar
Whether on Zoom or Teams, Webinars are easier than ever to hold.
10. Social Media Post
A post on LinkedIn, Instagram, etc.
11. Social Media Infographic
Usually a small infographic, like the size of a single Power Point slide.
12. Social Media Carousel
Like a stand alone presentation for social media.
13. Video
Posted to YouTube, embedded on your website, or shared through social media.
14. Executive Summary or One-Pager
Usually a short PDF report that can be printed or sent via email.
15. Slidedoc
A type of PDF report designed in landscape using a tool like a PowerPoint.
16. Excel Spreadsheet or CSV
A way to share data tables in a widely used tool.
17. Data Dashboard
An interactive way to share data.
18. Interactive Infographic or Journalistic Syle Article
A long form visual way to share a report.
19. Guest Post
Writing a blog post for a digital publication that has an existing audience you would like to reach.
20. Podcast Guest
Being a guest on a podcast that already reaches your target audience.
21. Live Workshop
Teaching the insights rather than simply sharing.
22. Online Course
Online platform for teaching insights to your audience.
23. Digital Toolkit
A collection of practical resources.
24. Press/Journalists
Sharing newsworthy insights.
25. Academic Journals
Peer focused, peer-reviewed, long-form articles.
26. Influencers
Sharing insights through trusted influencers.
27. Digital Q&As or Panel Conversations
Often through a webinar but sometimes through a chat, in order to put information in context.
Step 4. Putting the Theory of Use pieces together.
Now let’s pull everything together with a hypothetical program evaluation. Let’s say you are evaluating an after-school literacy program. We always start with the insight, but we’ll also include a source column just so we know exactly where the insight was derived.
| Source | 1. Insight | 2. Audience | 3. Mechanisms |
|---|---|---|---|
| Student Assessment Data | Students who attended 3+ days/week showed twice the reading growth | Client | Conversation, PDF Report, Executive Summary, and Presentation |
| Teacher Interviews | Teachers felt unprepared to support English language learners | Influencers | Press Release, Blog Post, Social Media Posts, Direct Email |
| Parent Survey | Many parents didn’t know how to reinforce literacy at home | Community | School District Parent Newsletter |
| Observation Data | A specific tutoring technique was consistently the most effective | Peers | Conference Presentation, Journal Article, Guest Blog Post in Education Blog |
| Student Assessment Data | Program served mostly high-performing students despite targeting struggling readers | Influencers | Policy Brief, Direct Email |
| Waitlist/Demand Data | Demand far exceeded capacity, suggesting a community-wide literacy crisis | Community | Community Town Hall Meeting, Local Newspaper Editorial |
| Assessment Data | Literacy challenges are widespread across the community, far beyond program capacity | Community | Community Town Hall Meeting, Local Newspaper Editorial |
| Program Data | Unknown | Open | Data Dashboard, HTML Report |
| Community Focus Groups | Families wanted more communication in their home language | Influencers | Webinar Feedback Session |
| Teacher Interviews | Teachers reported burnout as a major barrier to program fidelity | Client | Conversation, PDF Report, Executive Summary, and Presentation |
| All Data | Unknown | Public | Data Dashboard, HTML Report, Long-form Blog Post |
Revisions Made
[6/15/2026] Just added “10. Research/Evaluation Questions” to step number 1. Because you can certainly start this process before you have any insights, and questions give you a place to begin.
[6/12/2026] I’ve had a chance to use this with several clients. Step number 3 used to be Outcomes, but in practice it was far more useful to identify mechanisms. Using the Theory of Use as a diagnostic tool has shown me that many organizations don’t even have the established mechanisms necessary to reach their target audiences. So while the ultimate goal is still going to involve outcomes, the first step is to talk about the mechanisms that exist that connect insights with audiences.
[4/22/2026] When I first put this out I suggested you could adapt the Theory of Use into a Dissemination Plan. But after trying it a few times with clients I decided to take away the suggestion, here’s why.
In practice, this Theory of Use works really well at identifying blind spots. By pairing the insights with your audiences you quickly see which groups are being served, and which are not. It forces you think not just about the tools needed to reach the audiences, but whether or not you have the capacity to do so.
We rarely ever start from scratch. There is usually a set of deliverables or standard report formats. The question you can answer with a theory of use, is whether or not your current set of dissemination products is actually serving the audiences you intend to serve.
Final thoughts.
I designed Theory of Use to complement the evaluation and research frameworks you already use — not replace them. Utilization-Focused Evaluation gets us to intended use by intended users. Developmental Evaluation gets us to real-time learning. The CDC framework gets us to step six. Every major framework we have points toward use and then goes quiet at exactly the moment we need the most guidance.
Theory of Use is what happens next.
If you know of a framework that already does this well, I genuinely want to hear about it. Because I’ve been looking and I haven’t found one. And if this is actually the gap it appears to be, then we have a lot of work to do.
Our work is too important to disappear into a pdf archive. The insights are already there. Let’s get them to the people who need them.
I think this is brilliant! I love it. However, it would be very useful to me if you could do a YouTube video of how you would explain these steps to a person who is not familiar with evaluation. Thank you, Chris!
Just curious David, why YouTube? Been thinking about doing more videos but never know if it’s really worth the effort.
Yay Chris! This very much aligns with a realization our team had today as we struggled to streamline the end-of-contract evaluation reporting that public health departments are required to submit about their advocacy campaigns. We’ve been trying to balance the desire to lighten the reporting load but increase the utility of the reporting to the projects, and today we realized it should all be about insights. As a result, we whittled everything down to 5 questions as prompts:
I. What was the aim and outcome?
II. Which factors influenced the work?
III. How did the campaign tailor activities to specific populations?
IV. Which activities made the most difference?
V. What should the project do differently next time?
We are so excited to try it out!
Thanks for sharing Robin. Let me know how it goes!
Also curious, is there a singular audience or multiple?
Dear Chris,
Thank you for sharing this important piece of work. I really appreciated this post—especially the framing of insights as the true “product” of evaluation, rather than the report itself.
One distinction in Step 1 that I found myself reflecting on is between surprising findings and negative findings. My understanding is that these overlap but are not synonymous. Surprising findings are expectation?breaking—relative to theories of change, assumptions, or conventional wisdom—and can be either positive or negative. Negative findings, by contrast, are specifically about lack of effect, failure, or harm, whether or not they were anticipated.
I find this distinction useful because it influences both disclosure incentives and dissemination strategies: negative findings tend to face suppression due to risk and accountability concerns, whereas surprising findings (especially positive ones) often travel faster because they generate curiosity and narrative tension.
I’d love to hear whether this way of thinking resonates with your own reflections.
Thanks Sangita! When I was putting together that list I was thinking of it like a brainstorming tool. A way to think through your own findings to discover the insights. There is certainly a lot of of overlap but your example really talks through why some of these different types of insights are really set to travel differently than others.