I’ve recently rediscovered Robert K. Merton. As a student I knew a little about his social roles work but I knew very little about the person. That is until I happened upon On the Shoulders of Giant: A Shandean Postscript which is equal parts history and parody. It didn’t take long before I knew that this […]
Articles

They don’t like to try new things? Time to double deliver
I work in a pretty conservative company. But even in a risk-averse climate there are lots of opportunities to do interesting creative work. The trick to taking risks in these types of environments is to come prepared with a fallback. I’ve mentioned David Kelley‘s notion of double delivering before in passing (the quote below comes from […]

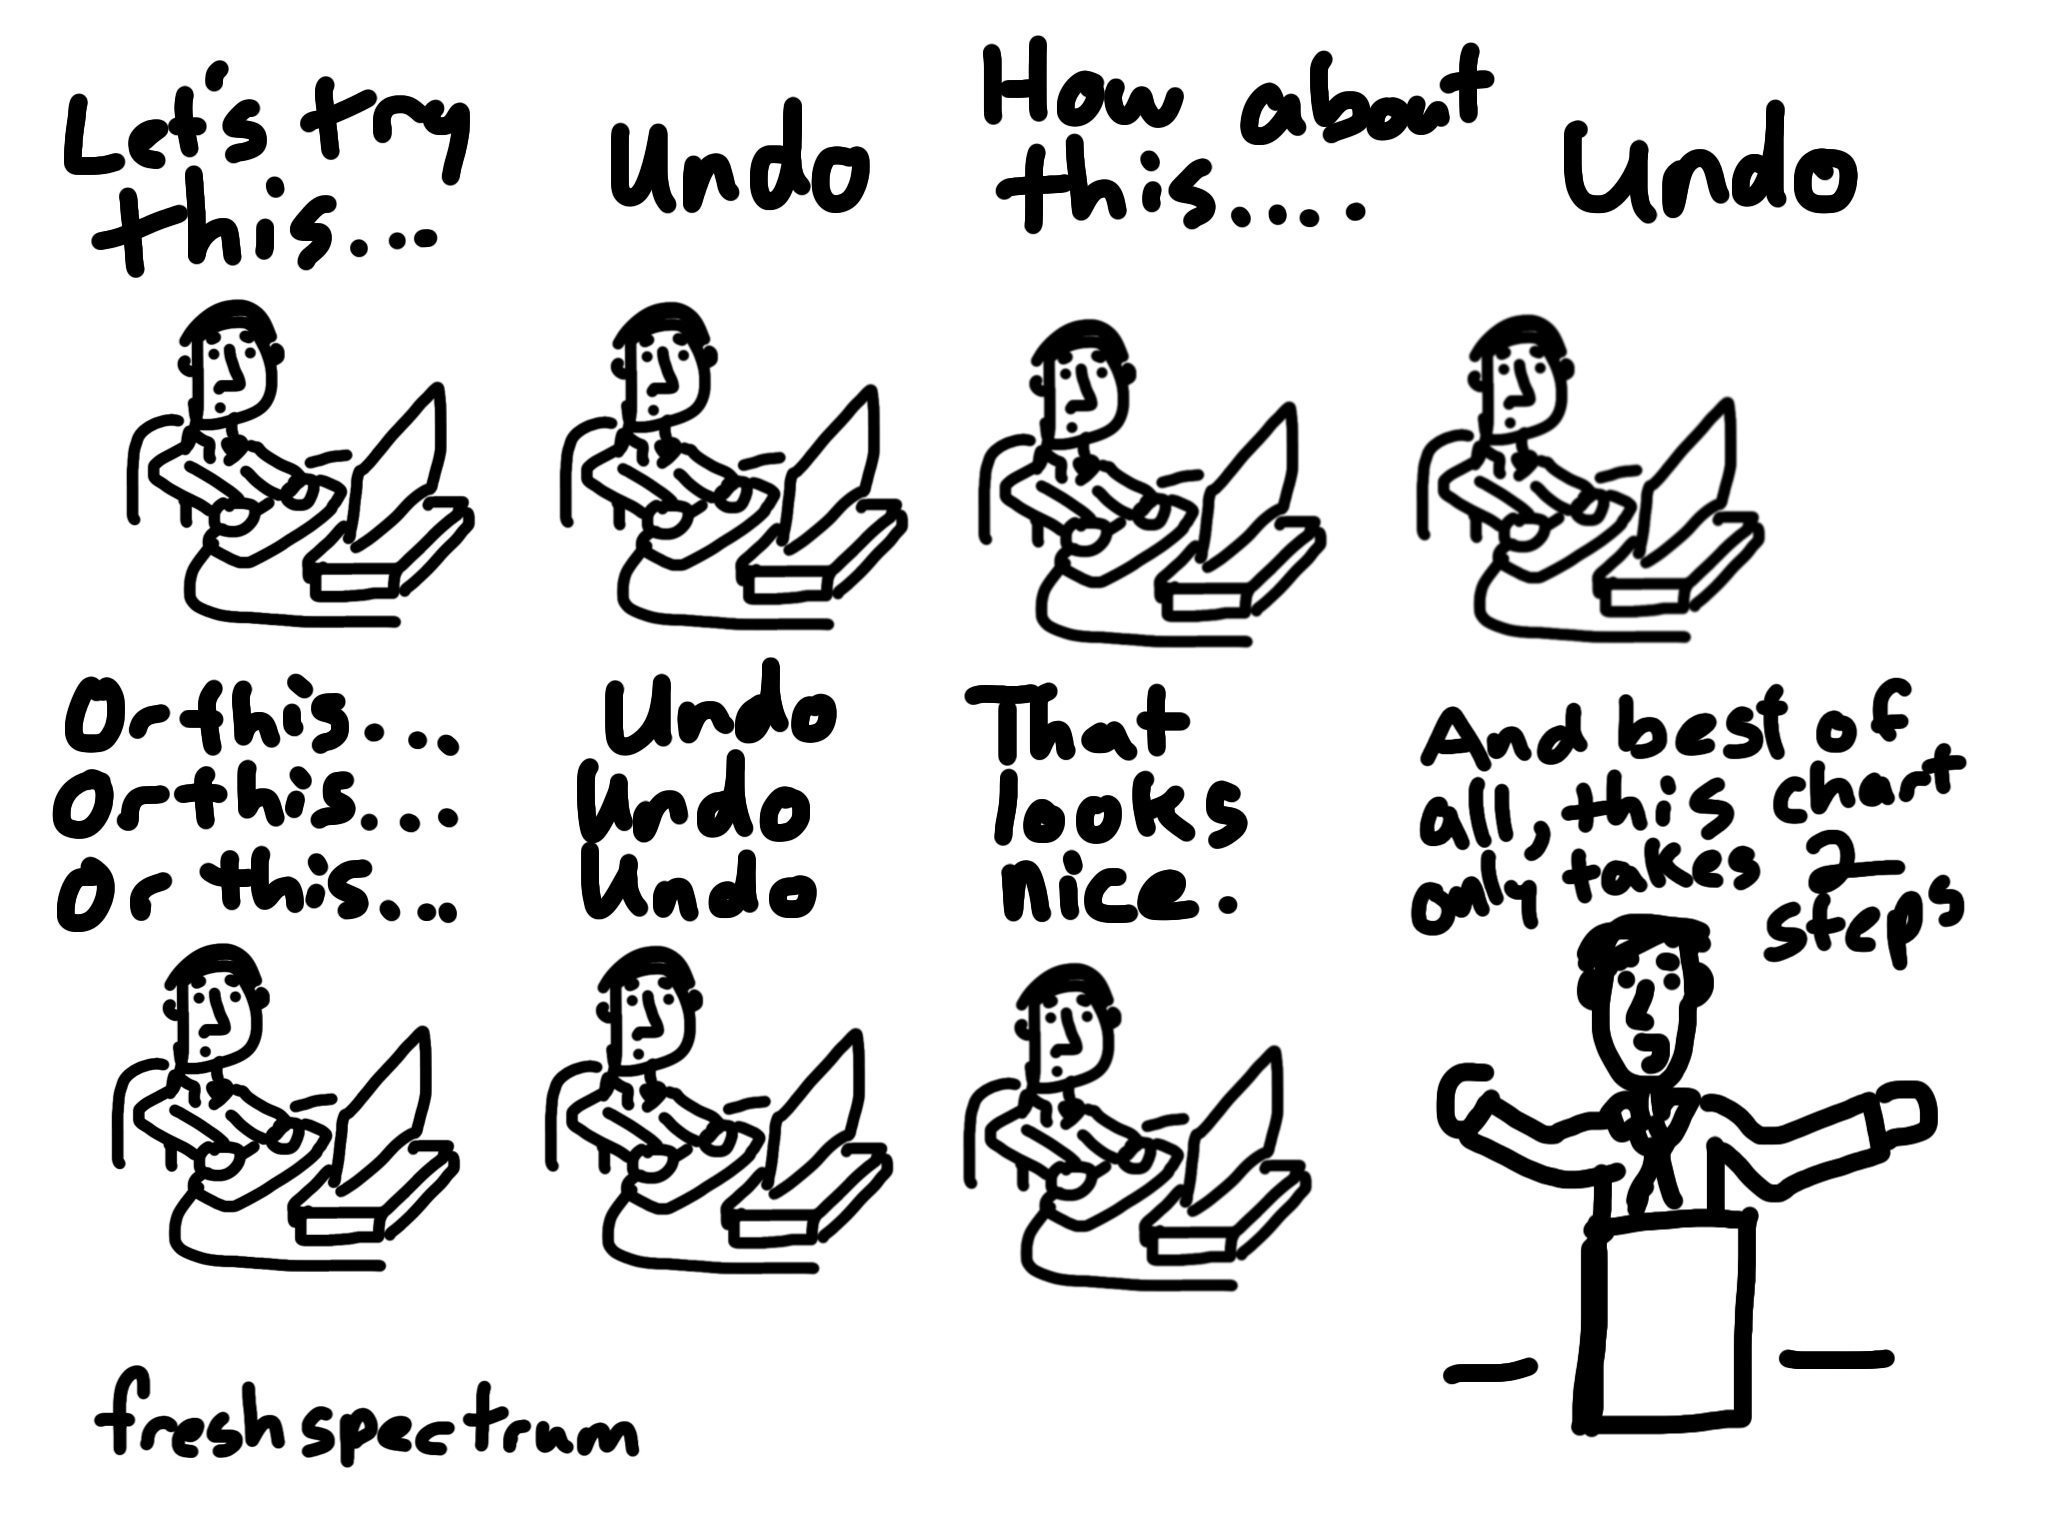
The courage to move beyond bullet points
Last week I got to hang out with my friend and data visualization rockstar Stephanie Evergreen, who stopped by my company for a day of talks. Her ability to connect with academic audiences is just amazing. At one point during the day I remember turning to look into the crowd and I could just see lightbulbs […]
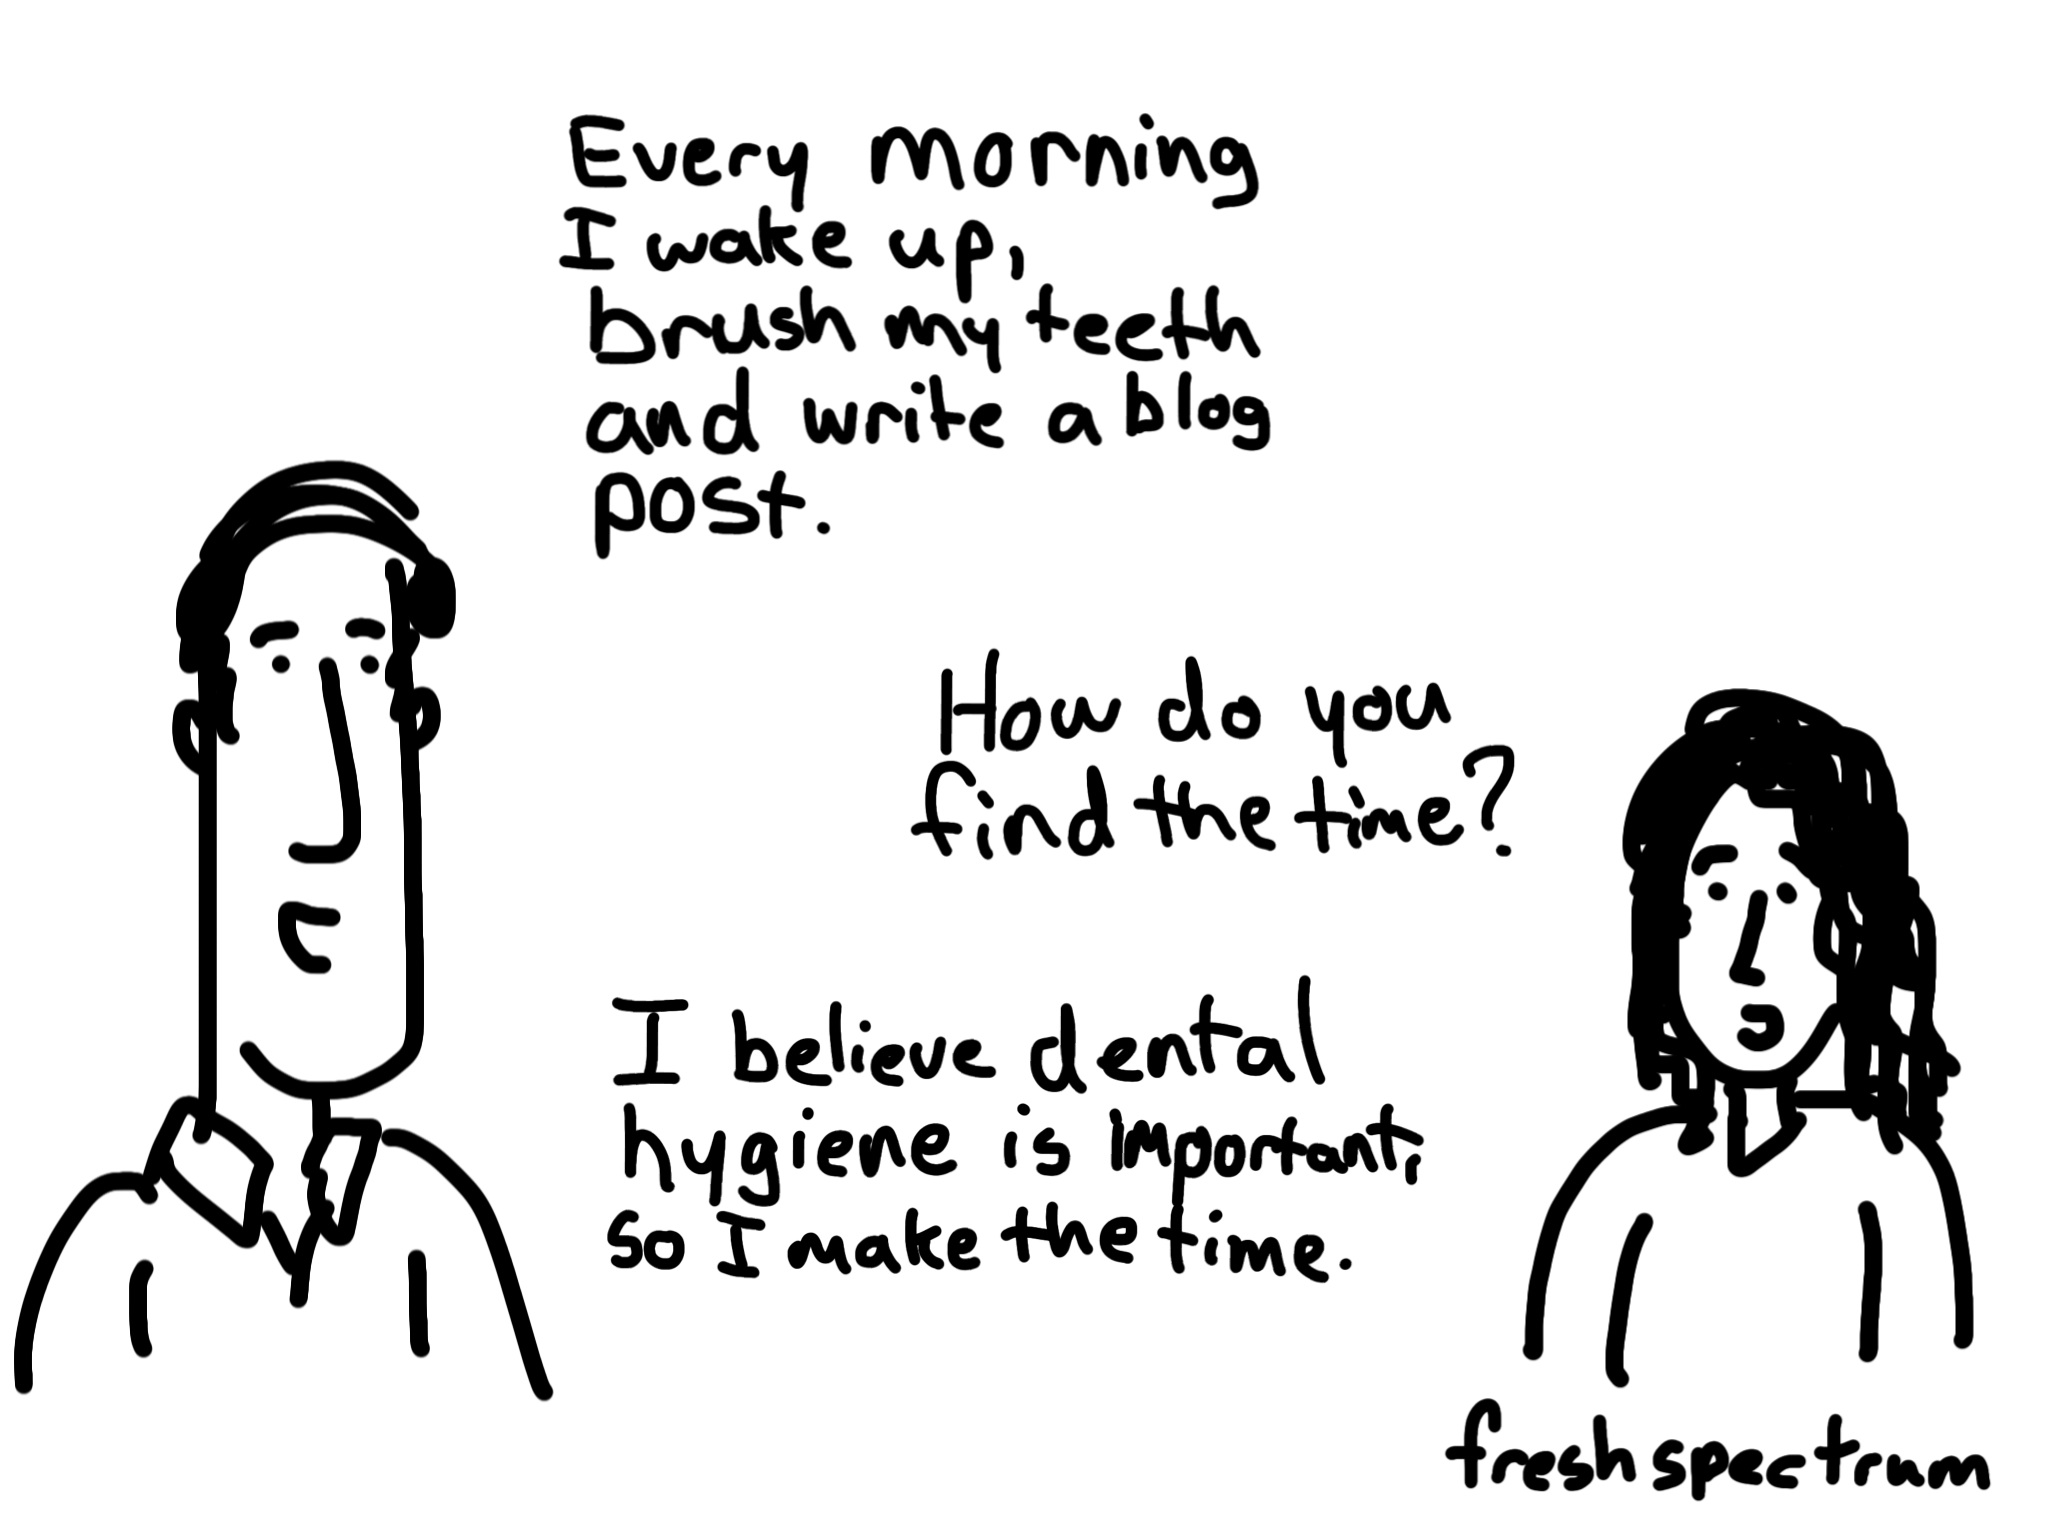
Cartooning Every Day
So I know I’ve been quiet lately. You know how it is, something comes up, you overextend and then all of a sudden you are knocked out of a habit. Then once you’re out, it can be really hard to get back in. For me there is only one way out. Cartoon my way! Daily […]

The Future of Data Visualization: Three Predictions
Prior to the holiday season Ann K Emery asked a group of us bloggers to come up with some data visualization predictions for the upcoming year. Here are 3 of my own predictions based on some of the things I already see happening (a.k.a. projections). What are your predictions? Let me know in the comments. […]

Qualitative cartoons from MQP’s latest book
Michael Quinn Patton just came out with the fourth edition of his Qualitative Research and Evaluation Methods book and in it you’ll find 9 of my cartoons. The new cartoons are based largely on a series of ruminations added to each chapter (you can find a few rumination examples over at better evaluation). Today’s post […]