
The research and evaluation worlds are filled with boxes and arrows. The models that are built this way become central to how projects are imagined and evaluated. As an exercise in program design or research design, I think your everyday box and arrow type of model is fine. But when it comes time to disseminate, […]
Articles

New Seedlings by Mady
My daughter joined me at work today, as she has been doing weekly over the latter part of the summer. I asked her to draw me a picture and write me a poem for my blog. She also drew a picture of me to go alongside. Here is Mady’s poem. It’s called New Seedlings. Lovely […]

Confederate Monument History
In case it was too subtle in the cartoon. Confederate monuments were not memorials but part of a toolbox used by racists to intimidate blacks especially during the early through mid 1900s. They should not be sitting in front of public courthouses with plaques that give the impression that they are just simple memorials. They […]

Tableau Like
Another day another website. I decided to split off my professional data design work and start building an online portfolio. So if you want to get a sense for what my professional visualization work looks like, head over to Lysy Design.
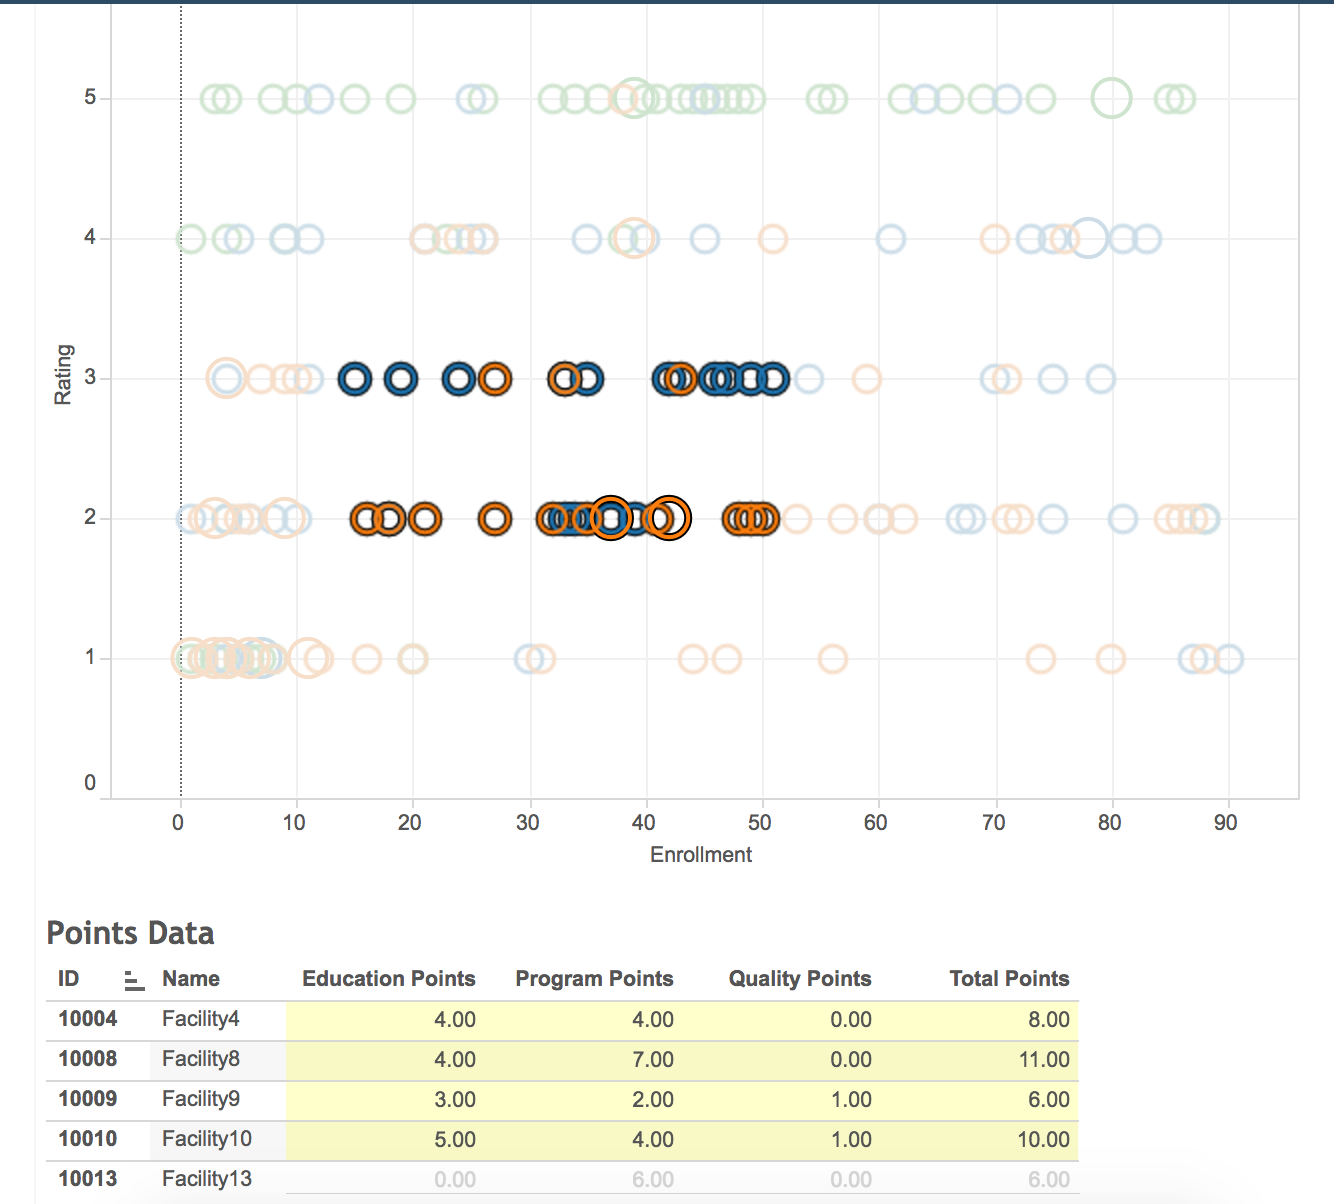
Tableau Dashboards
We collect tons of data every single minute of every single day. Unfortunately, not all of that data is in a format or location where we could access it and start to understand the lessons embedded within. If you do find yourself with a lot of data, building a dashboard could help pave the way […]

Vector and Interactive Infographics
Today’s reporting needs are diverse. No more getting by with a long end of year report and a couple of briefs. Contemporary reports are layered collections of social media images, print one-pagers, posters, infographics, websites, and videos. I design infographics using professional vector graphic design tools. By creating graphics using math instead of pixels, you […]