
Over the next couple of weeks, I’ll be sharing 10 of the cartoons I created for the Rameses Project on realist evaluation. Visit that site to get access to the full collection. If you’re at all interested in the illustration process I follow when drawing cartoons like these, I wrote about it at Lysydesign.
Articles

But why is the swan black?
It’s the difference between is this true, is this false, and is this interesting. Over the next couple of weeks, I’ll be sharing 10 of the cartoons I created for the Rameses Project on realist evaluation. Visit that site to get access to the full collection. If you’re at all interested in the illustration process I follow […]
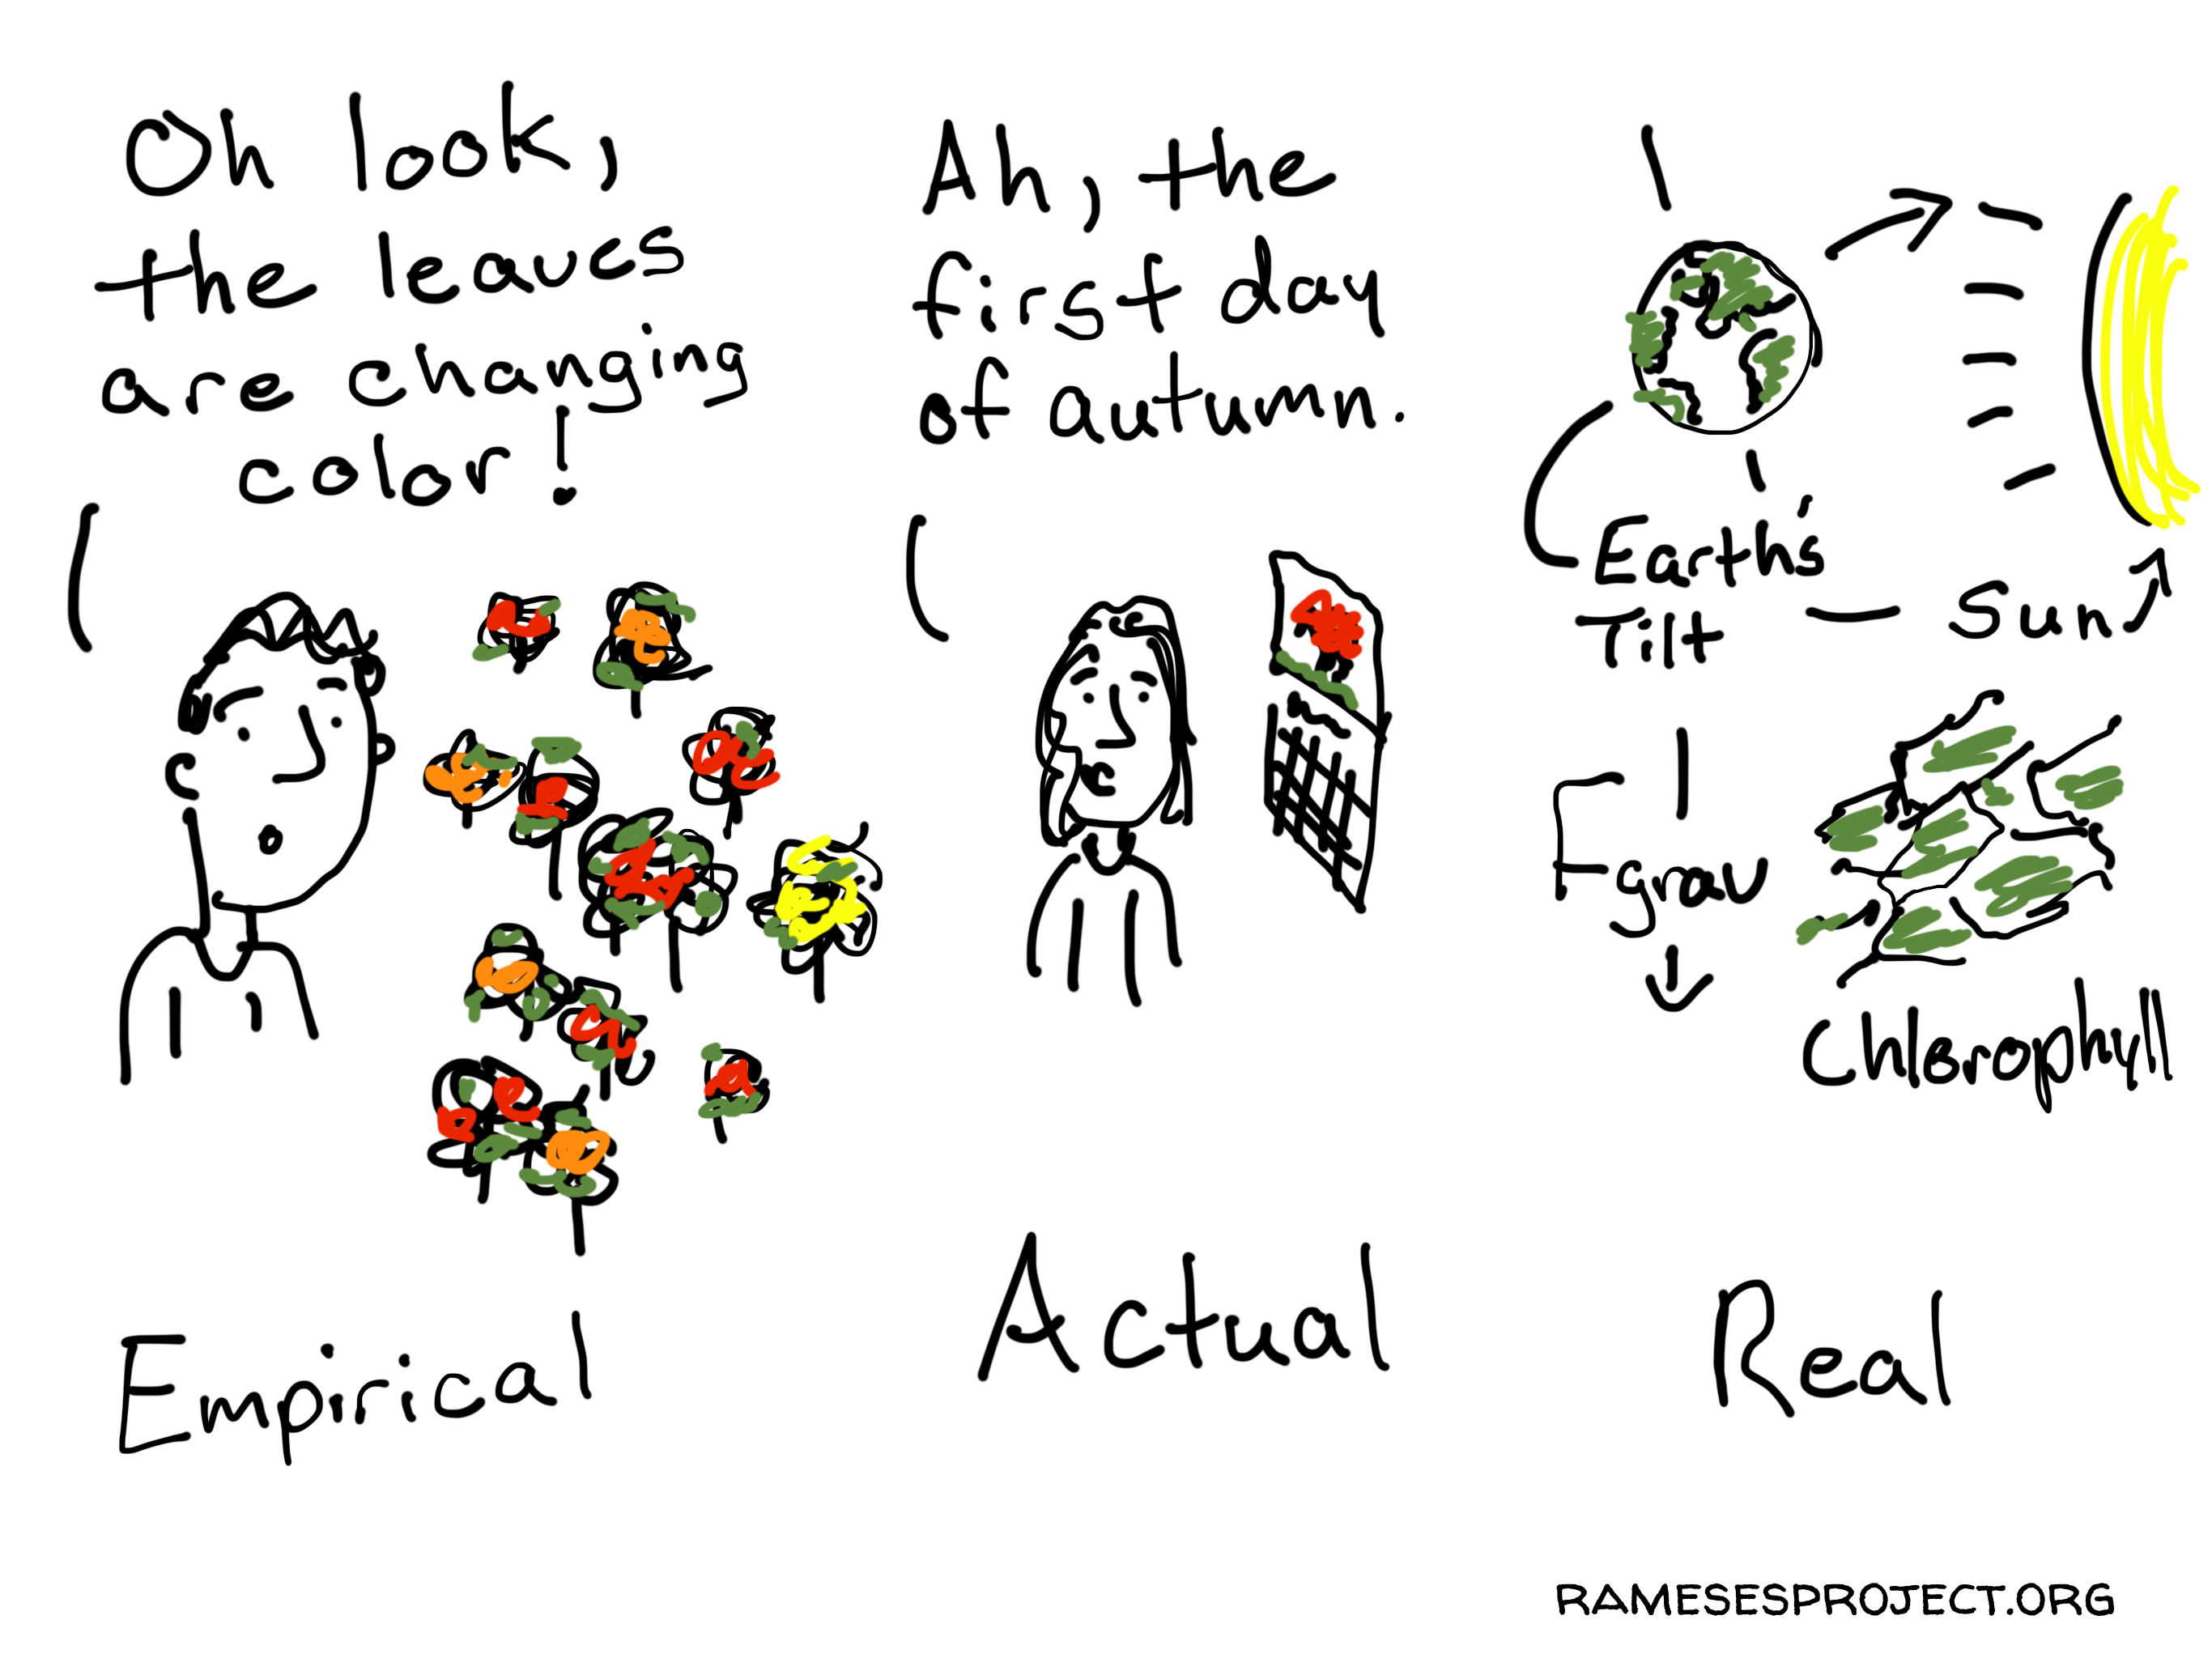
Empirical Actual Real
I had to tweak this cartoon, originally it said the “first day of fall.” Over the next couple of weeks, I’ll be sharing 10 of the cartoons I created for the Rameses Project on realist evaluation. Visit that site to get access to the full collection. If you’re at all interested in the illustration process I follow […]

Not just what you ask
A change in context, “like who asks the question,” can make a difference. Over the next couple of weeks, I’ll be sharing 10 of the cartoons I created for the Rameses Project on realist evaluation. Visit that site to get access to the full collection. If you’re at all interested in the illustration process I follow when […]
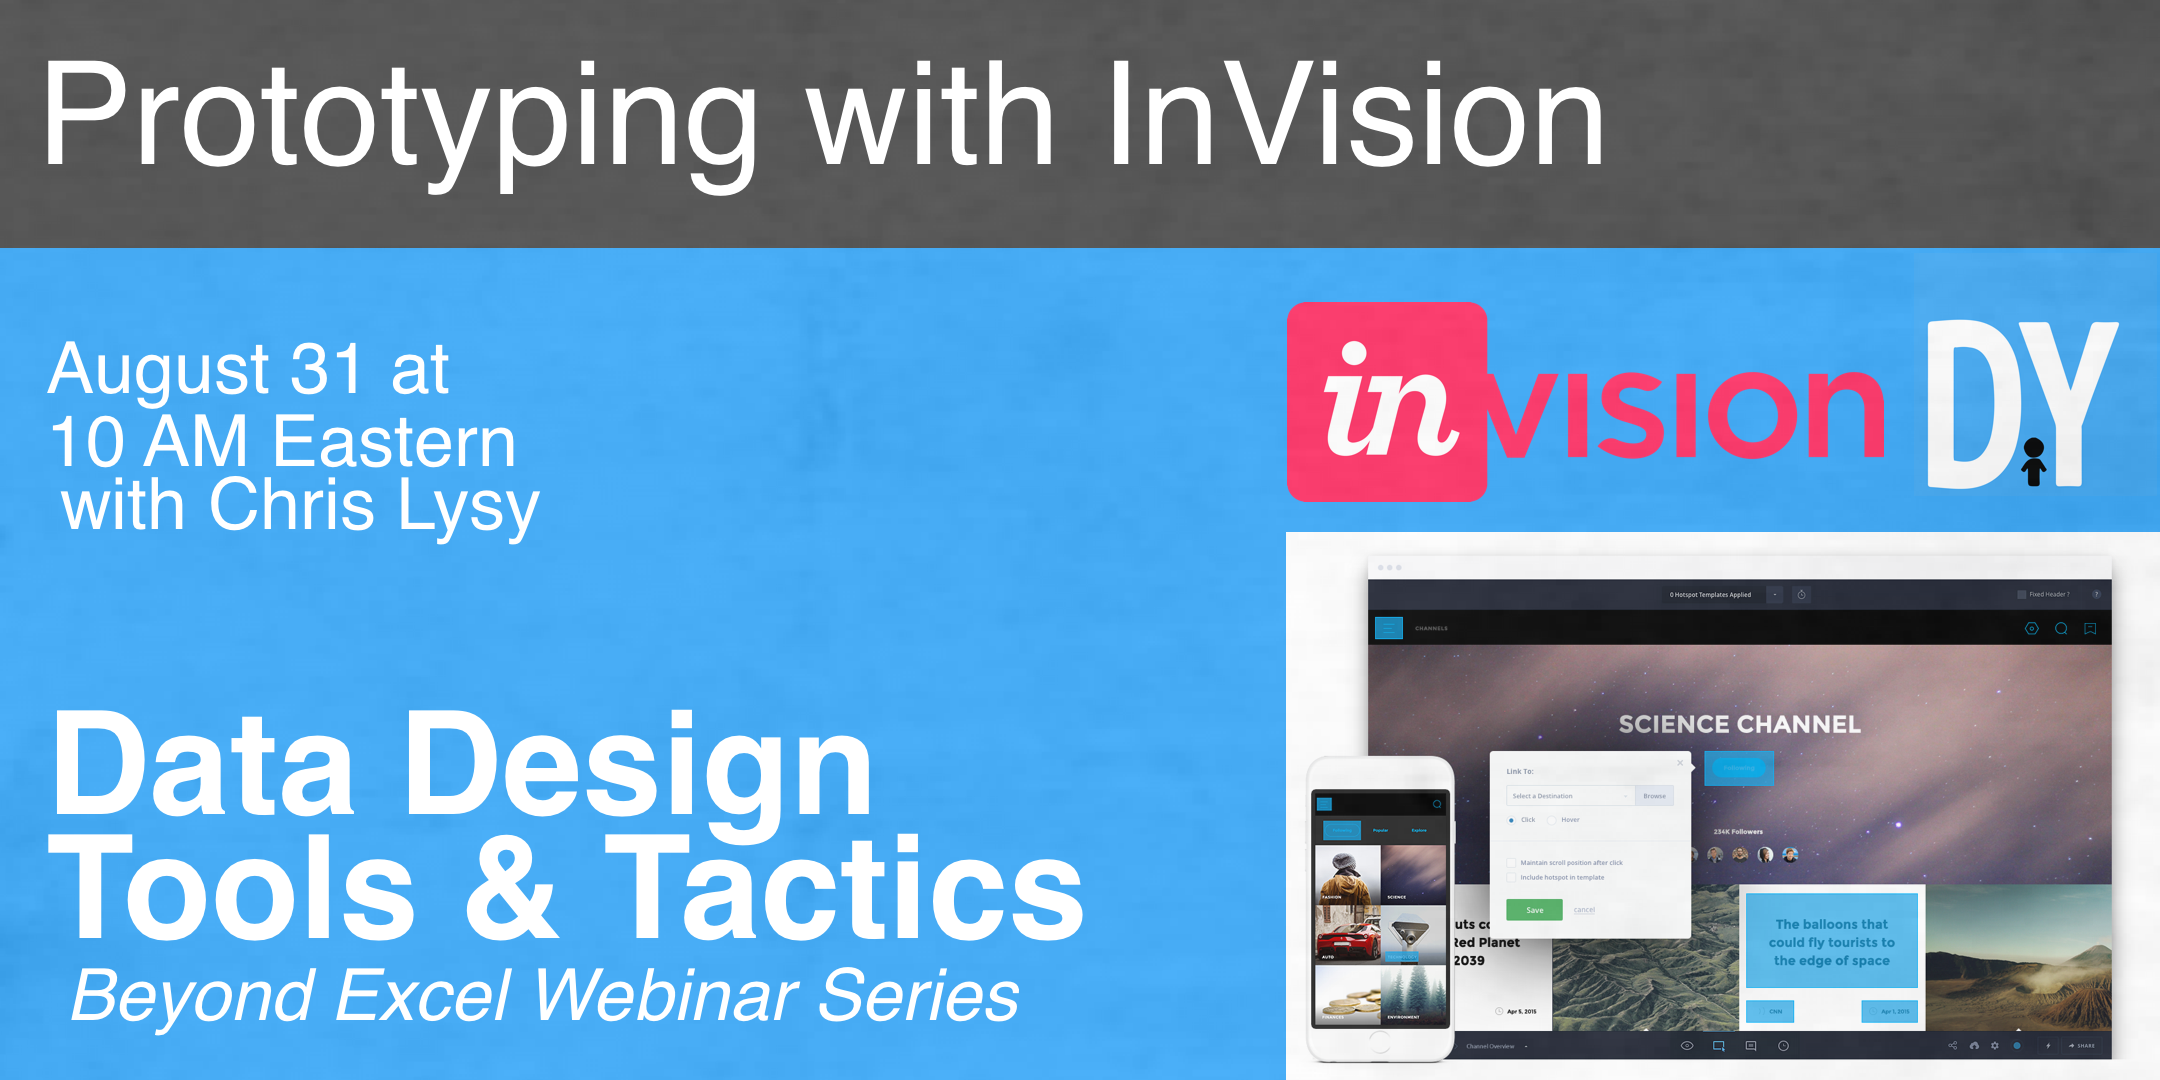
Prototyping with InVision
This week on Thursday, August 31st at 10 AM EDT, I’ll be holding a webinar on prototyping. This is part of a new series of free webinars I’ll be launching on Data Design Tools & Tactics Webinar Series. Registration is limited to 50 (but I’ll be reserving an additional 50 spots exclusively for members of […]

Keeping with the Protocol
So a realist protocol isn’t set in stone. You can go around the dragon. Over the next couple of weeks, I’ll be sharing 10 of the cartoons I created for the Rameses Project on realist evaluation. Visit that site to get access to the full collection. If you’re at all interested in the illustration process […]