
Is your data dashboard useful? How do you know? Most of the time it’s a question that gets left unanswered. As if the dashboard getting created is enough, and whether or not it works is really not that important. Perhaps it’s the data idealist in me, but I think we can do better. TLDR: I […]
How to create a basic logic model [activity book]
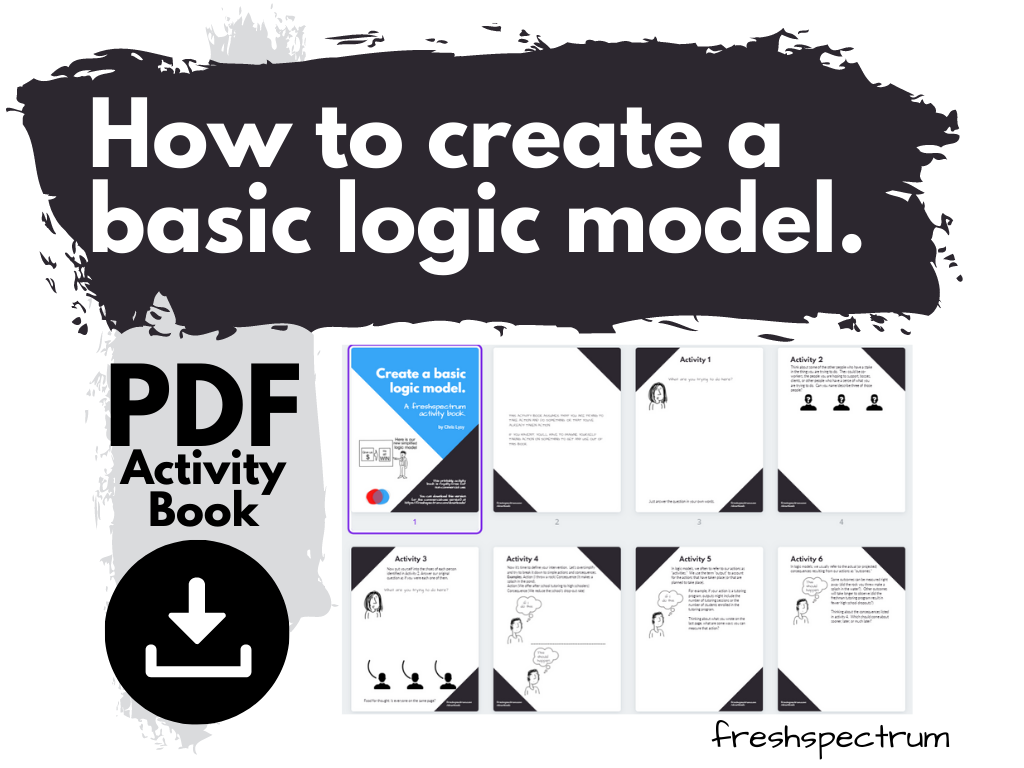
Working with a group to create a logic model? I created a little activity book to help you on your way. Prerequisite (Before you Download) This activity book assumes that you are trying to take action and do something. Or that you’ve already taken action. If you haven’t, you’ll have to imagine yourself taking action […]

What is the difference between a Histogram and a Bar Graph?
If you want to be taken seriously as a data professional, there are some things that you just need to know. The difference between a Bar Chart and a Histogram is one of those things. This post is a little cartoon illustrated explanation of the differences. In short: the difference between a Bar Graph and […]