
If I could go back in time to my university days, I would certainly take some different electives. Like so many of you, I spent my time in college learning how to be a social scientist. Which included absolutely zero practical creative or design courses. My professional evolution would probably have been easier if I […]

Finding meaning in our work
I fell into the world of data visualization in 2008, when an executive at the non-profit I was working for at the time decided to send a few of the younger staff members to a local talk by Edward Tufte. My colleagues were mostly underwhelmed, but I came away changed (and with his 4 books […]

Data Storytelling Comics
As I get ready to deliver my live data storytelling workshop (now self-paced with future live sessions included), I decided to develop a series of comics. My goal over the next week is to create at least 20 (note from future me: I failed, I only made it to 14). If you have any data […]

Events
On this page I’ll be listing all upcoming live events, along with the relevant registration or RSVP pages. June 2024 6/25 & 6/27 – Workshop: Everyday Visual Reports [Register] The next live session of my Everyday Visual Reports workshop is scheduled for Tuesday, June 25 & Thursday, June 27 starting at 3:00PM Eastern. The workshop […]

We are story finders.
When I started drawing comics, back in the early 2010s, there were these really popular animations put together by the Royalty Society of Arts (RSA) in London. My comics have always been pretty simple in format. And early on, before I would even attempt to draw hands, they were even simpler. So often I would […]
Who is the Hero? Storytelling Methods for Data People.
Good stories always have heroes, even data stories. So who is the hero in your story? So technically, a story is just a sequence of events. And you can layout a sequence of events without the use of characters. But thinking of your stories, and telling them, through the eyes of characters (especially a good […]
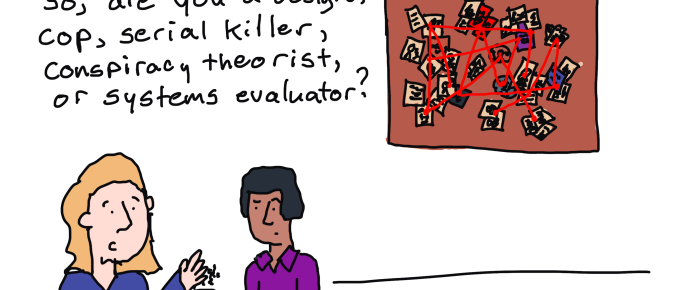
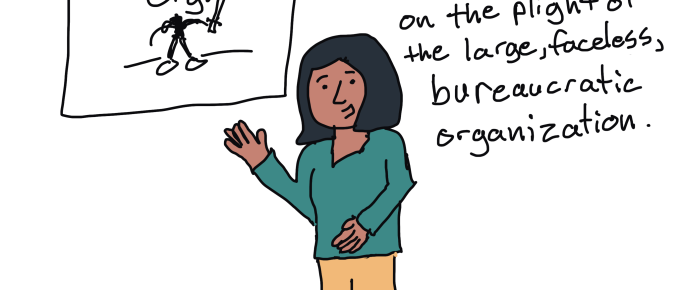
128 Evaluation Cartoons for Presentations and Blog Posts
Looking for an evaluation related cartoon for your next presentation or blog post? Well, over the last decade I’ve drawn thousands. In this post, I’m sharing 111 128 of my evaluation cartoons (added a few new ones), including a lot of community favorites. Please feel free to save to your computer, add to your presentations, […]

What is Card Sorting? UX Methods for Data People
Card sorting is a user experience research method useful in discovering how people organize and prioritize different topics. The method is pretty simple. You start with a set of topics on notecards or sticky notes. Then you ask your research participant to organize those cards in a way that makes sense to them. At least […]

How to become a data designer.
Ever wonder why some data teams deliver really nice looking reports while others seem like they’re stuck in the late 90s? The more I work with different research and evaluation teams, the more I find that reporting quality usually comes down to the skills of just a few people. First, you need a manager who […]

How to create a scatterplot in Canva!
The scatterplot is one of my favorite graph types. So how do you create one in Canva? Just an FYI – Canva acquired Flourish in 2022. A couple of years later you can see some small changes in some of Canva’s graph designs. But for the most part, I find it better and smoother to […]

My Cartoon Illustration Process – Realist Evaluation Comics
Back in 2017 I was commissioned by the RAMESES II project (funded by *NIHR) to draw a series of cartoons on realist evaluation. They have been made available for royalty-free use at ramesesproject.org, along with a collection of other realist evaluation resources. In this blog post I want to take you through my cartoon illustration […]

Evaluation versus Monitoring
Today’s post started as a comic request and turned into a Q&A. Here is the question that came to me from Randi Knox. I’m looking for a comic to communicate the difference between program monitoring vs program evaluation. I didn’t see anything specific to this in your existing materials. I was wondering if you’d be […]