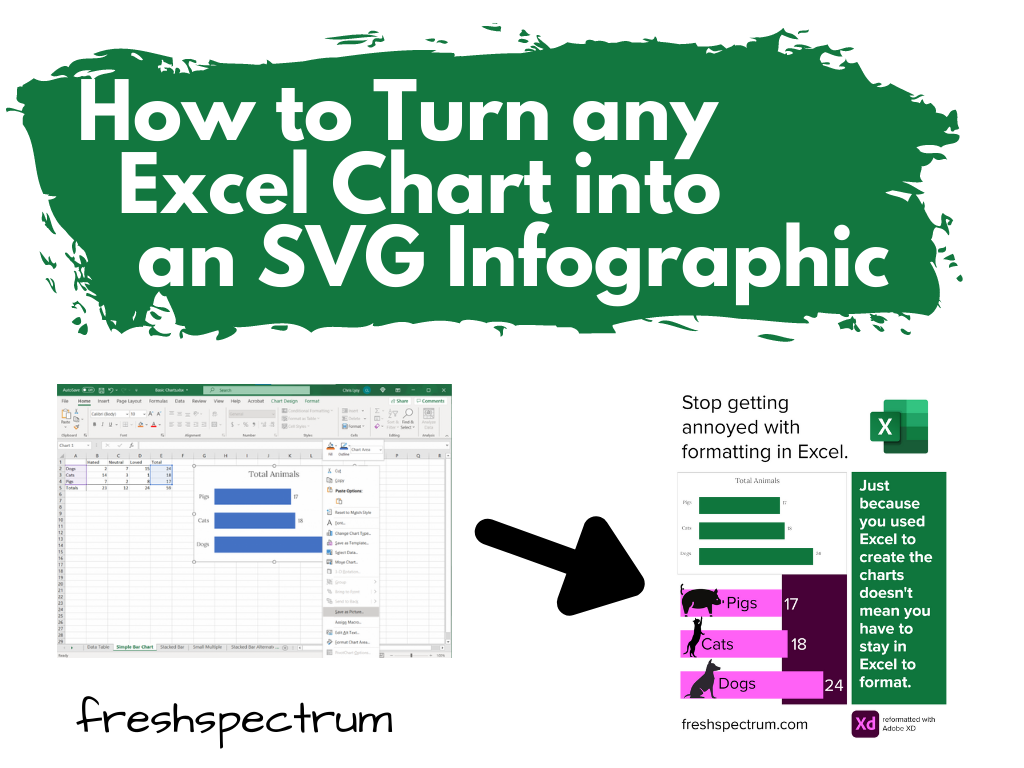
Ever get annoyed with formatting after you create a chart in Excel? It’s pretty easy to create a chart in Excel. A couple of button clicks and poof, there you go, chart created. But if you want to create a chart that actually looks good, you often have to do a bit more work. For […]

What you will learn if you join my workshop.
Just a note before I jump in. The pre-launch discount for my workshop expires tomorrow (9/8) at 12PM eastern. The workshop will never be cheaper! Over the years, when a colleague would take a workshop at a conference, I would ask them what they learned. And then I would ask, “was it worth the money?” […]
It’s not about the charts.
If you just want to create better charts, don’t join my workshop. I have no desire to compete with my friends Stephanie Evergreen and Ann K Emery on fundamental visual reporting and chart literacy. If you just want to code with R or Python, don’t join my workshop. Two suggestions. David Keyes for all things […]

Beyond Better Charts – My New Workshop on 21st Century Reporting
If nobody sees your amazing chart, can you still call it amazing? For data to have an impact, it needs to be the right data, reaching the right person, at the right time, and in the right format. That’s a lot that has to go right. And only a little of it has anything to […]

Why your online evaluation capacity building efforts are doomed to fail
This post was written for, and originally appeared, on AEA365. Hello my fellow evaluators. My name is Chris Lysy, and I am a freelance evaluator, designer, and trainer based in Cary, North Carolina. My consulting work involves helping organizations deal with the virtual shift (shifting programs from the “real world” to the “virtual world”). Over the […]

UX Evaluation: How to Evaluate Dashboards, Reports, and Data Visualization
Is your data dashboard useful? How do you know? Most of the time it’s a question that gets left unanswered. As if the dashboard getting created is enough, and whether or not it works is really not that important. Perhaps it’s the data idealist in me, but I think we can do better. TLDR: I […]
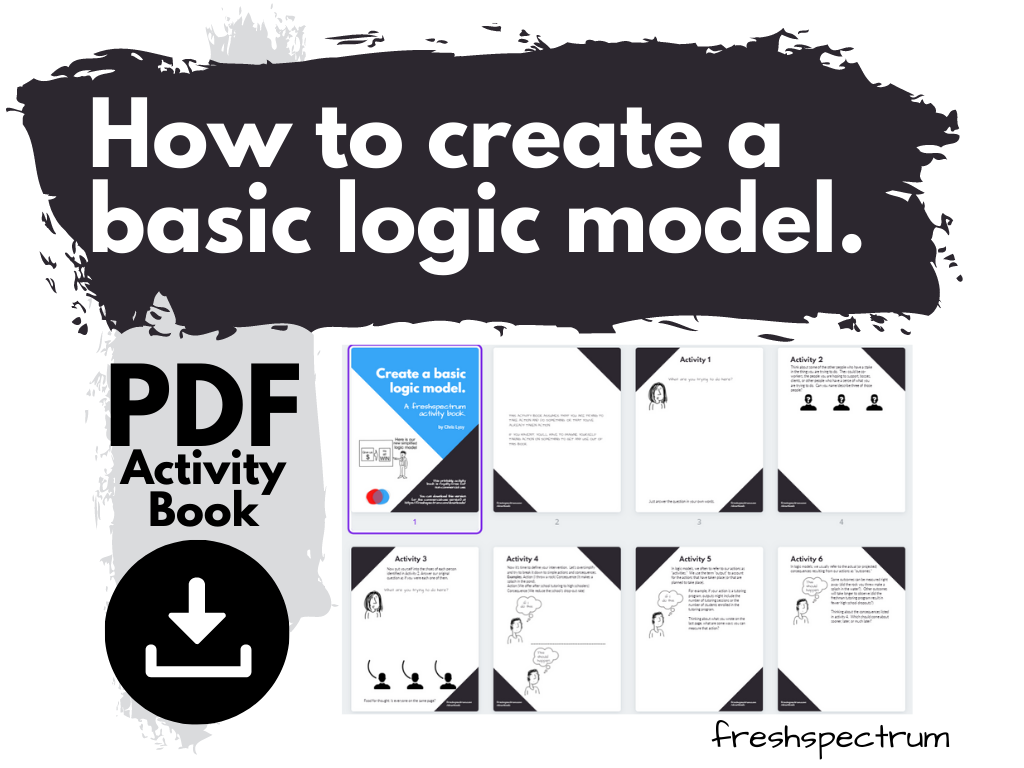
How to create a basic logic model [activity book]
Working with a group to create a logic model? I created a little activity book to help you on your way. Prerequisite (Before you Download) This activity book assumes that you are trying to take action and do something. Or that you’ve already taken action. If you haven’t, you’ll have to imagine yourself taking action […]

What is the difference between a Histogram and a Bar Graph?
If you want to be taken seriously as a data professional, there are some things that you just need to know. The difference between a Bar Chart and a Histogram is one of those things. This post is a little cartoon illustrated explanation of the differences. In short: the difference between a Bar Graph and […]

Evaluation Blogging
Dear Evaluator, I think you should blog. Partially for selfish reasons. The social world is undergoing fundamental changes that will shape our collective future. As an evaluator you are positioned to observe those changes first hand. And I want to hear what you have to say. We all have unique perspectives and backgrounds, but it’s harder […]
Evaluation Subcontracting Business Model
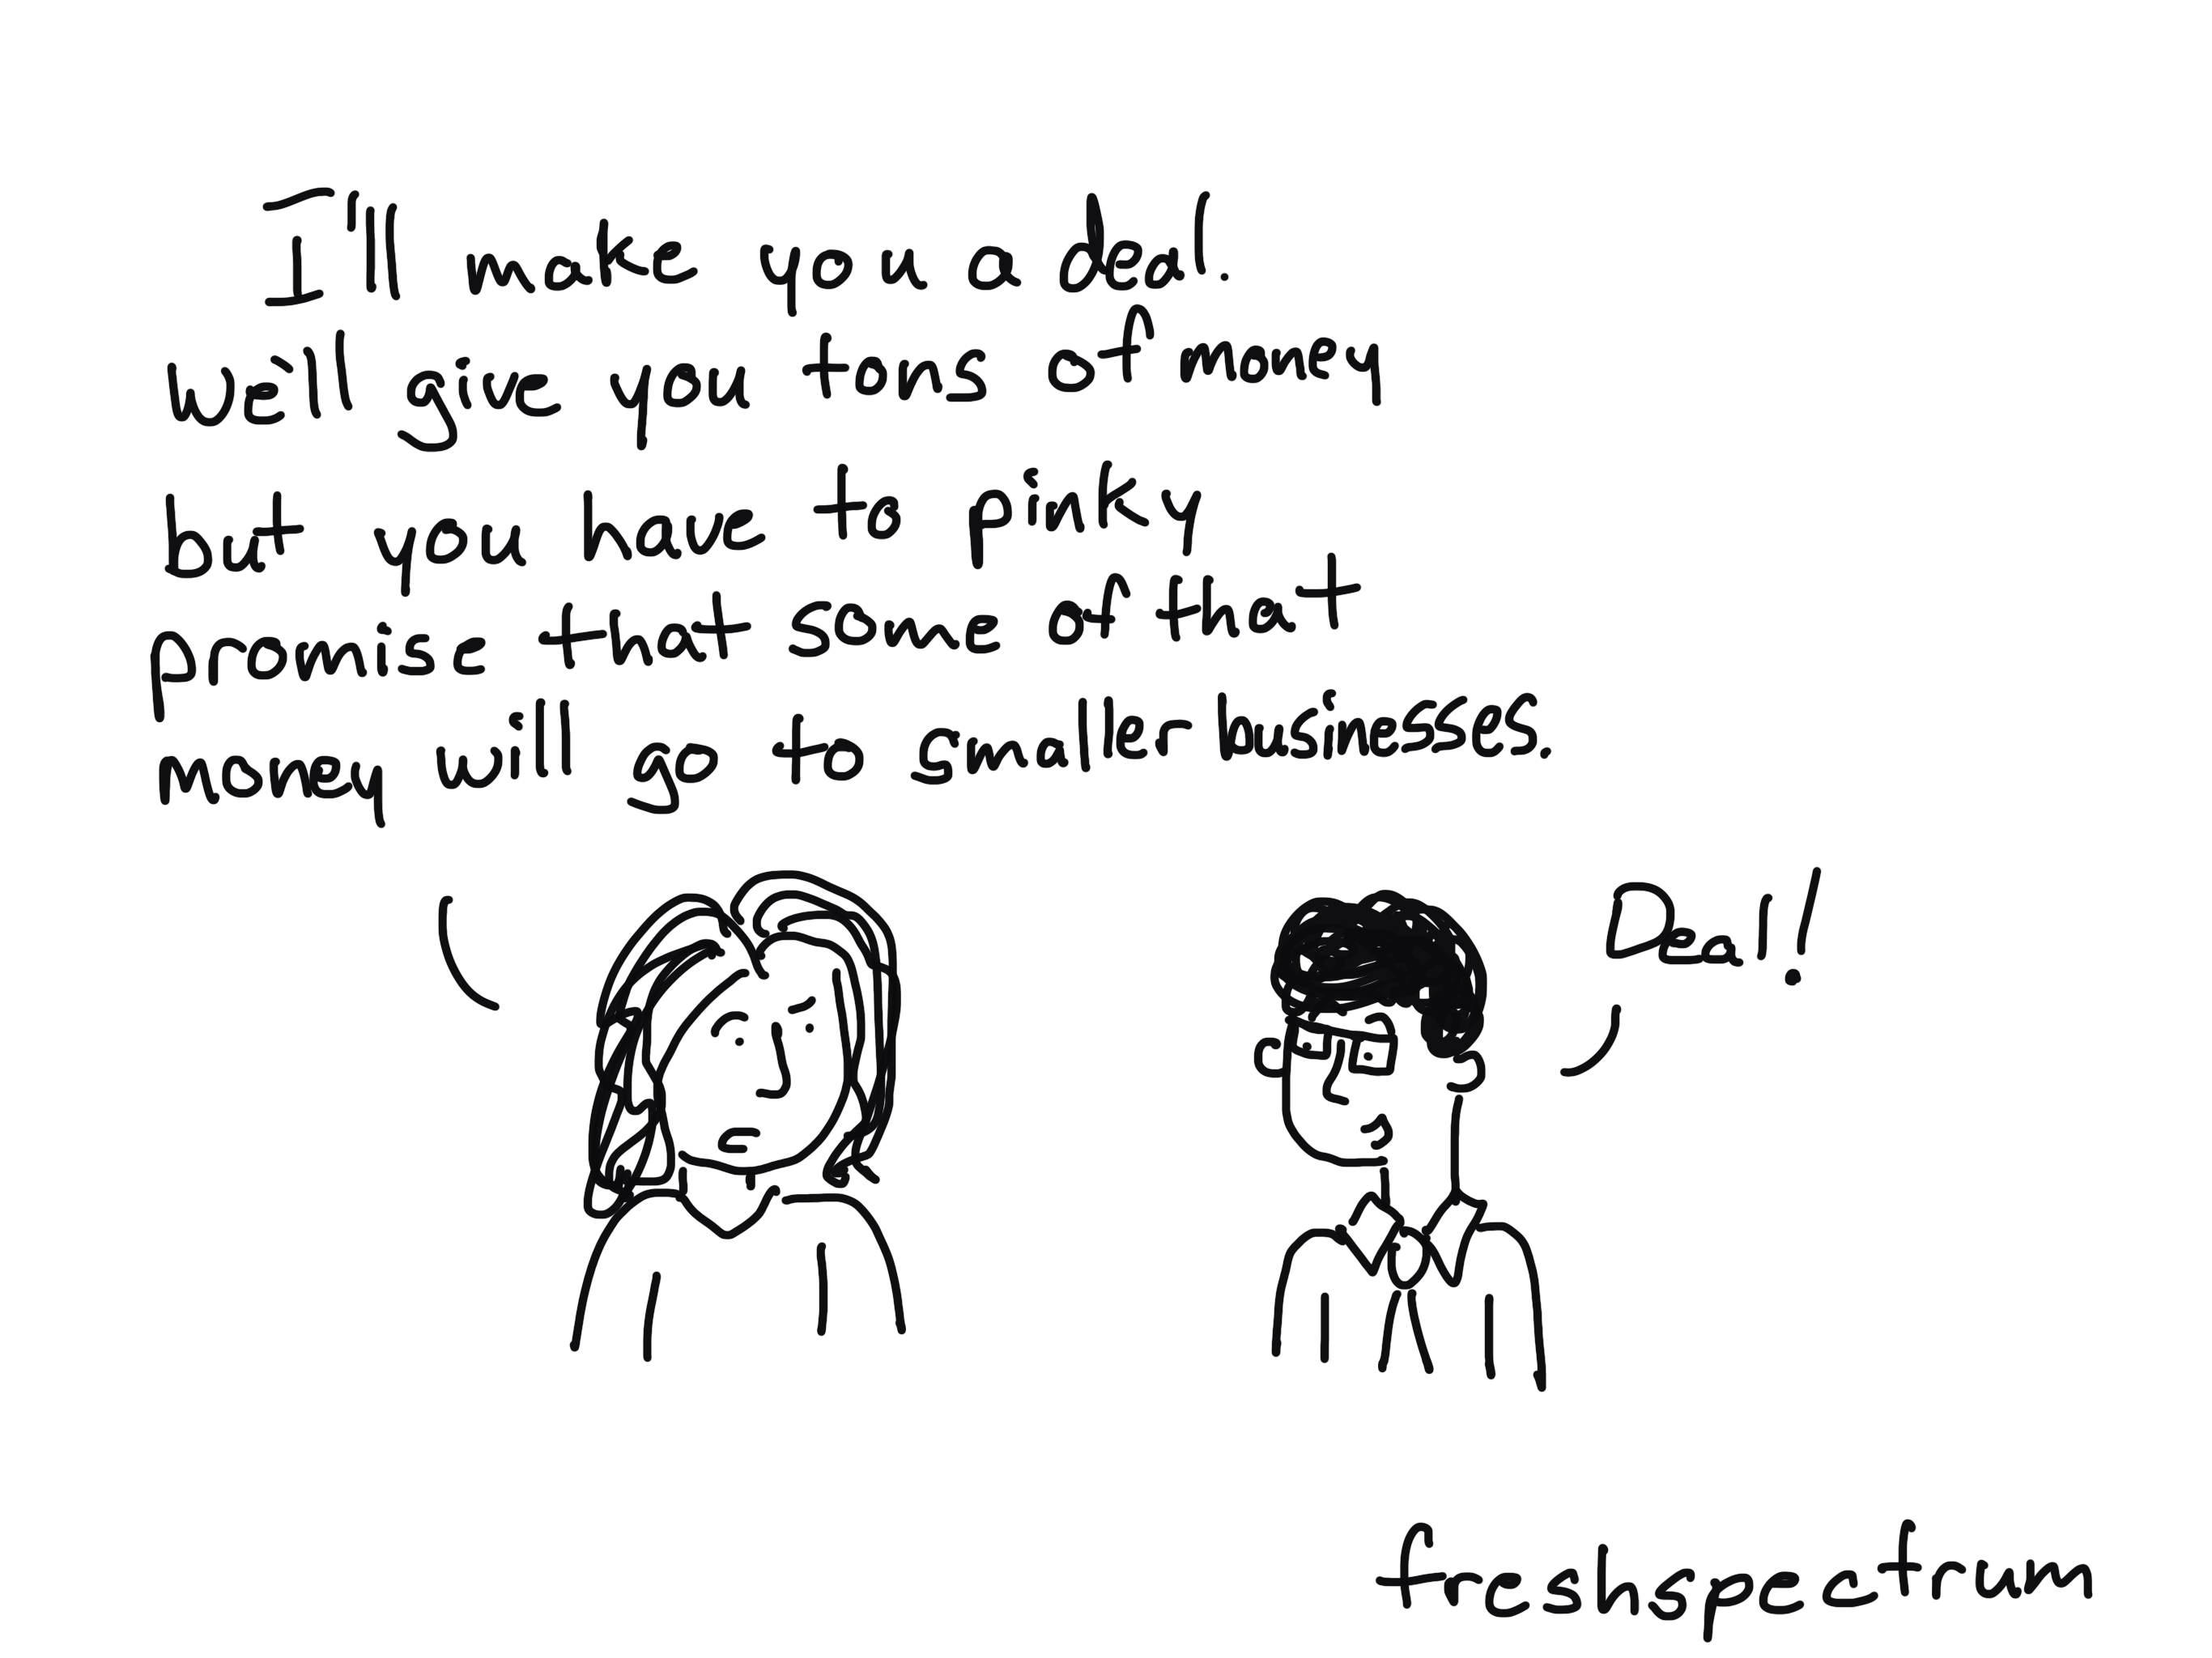
Have you ever noticed how the large well-known consulting firms seem to consistently get the biggest contracts. How is a small business even supposed to compete? Maybe you’re not. But if you can’t beat ’em, join ’em. In this post: Why the big companies tend to get the big contracts. The subcontracting business model. What […]