An illustrated guide to business planning for freelancers, consultants, and other professionals hoping to trade hours for dollars. Inspired by my friend Kendra, who asked me to write down our conversation and share it with others. Not quite a business, not quite a job. I work in an open co-working space located in the middle […]

The Effective Philanthropy Resource Site Showdown – [a graphic novel data analysis]
The digital world is filled with underutilized data. I created this experimental data analysis as a way to show how datasets embraced by the SEO world can be valuable evaluation resources. If the analysis leaves you with more questions. At the end of the post you will find a link to a Tableau Public dashboard […]
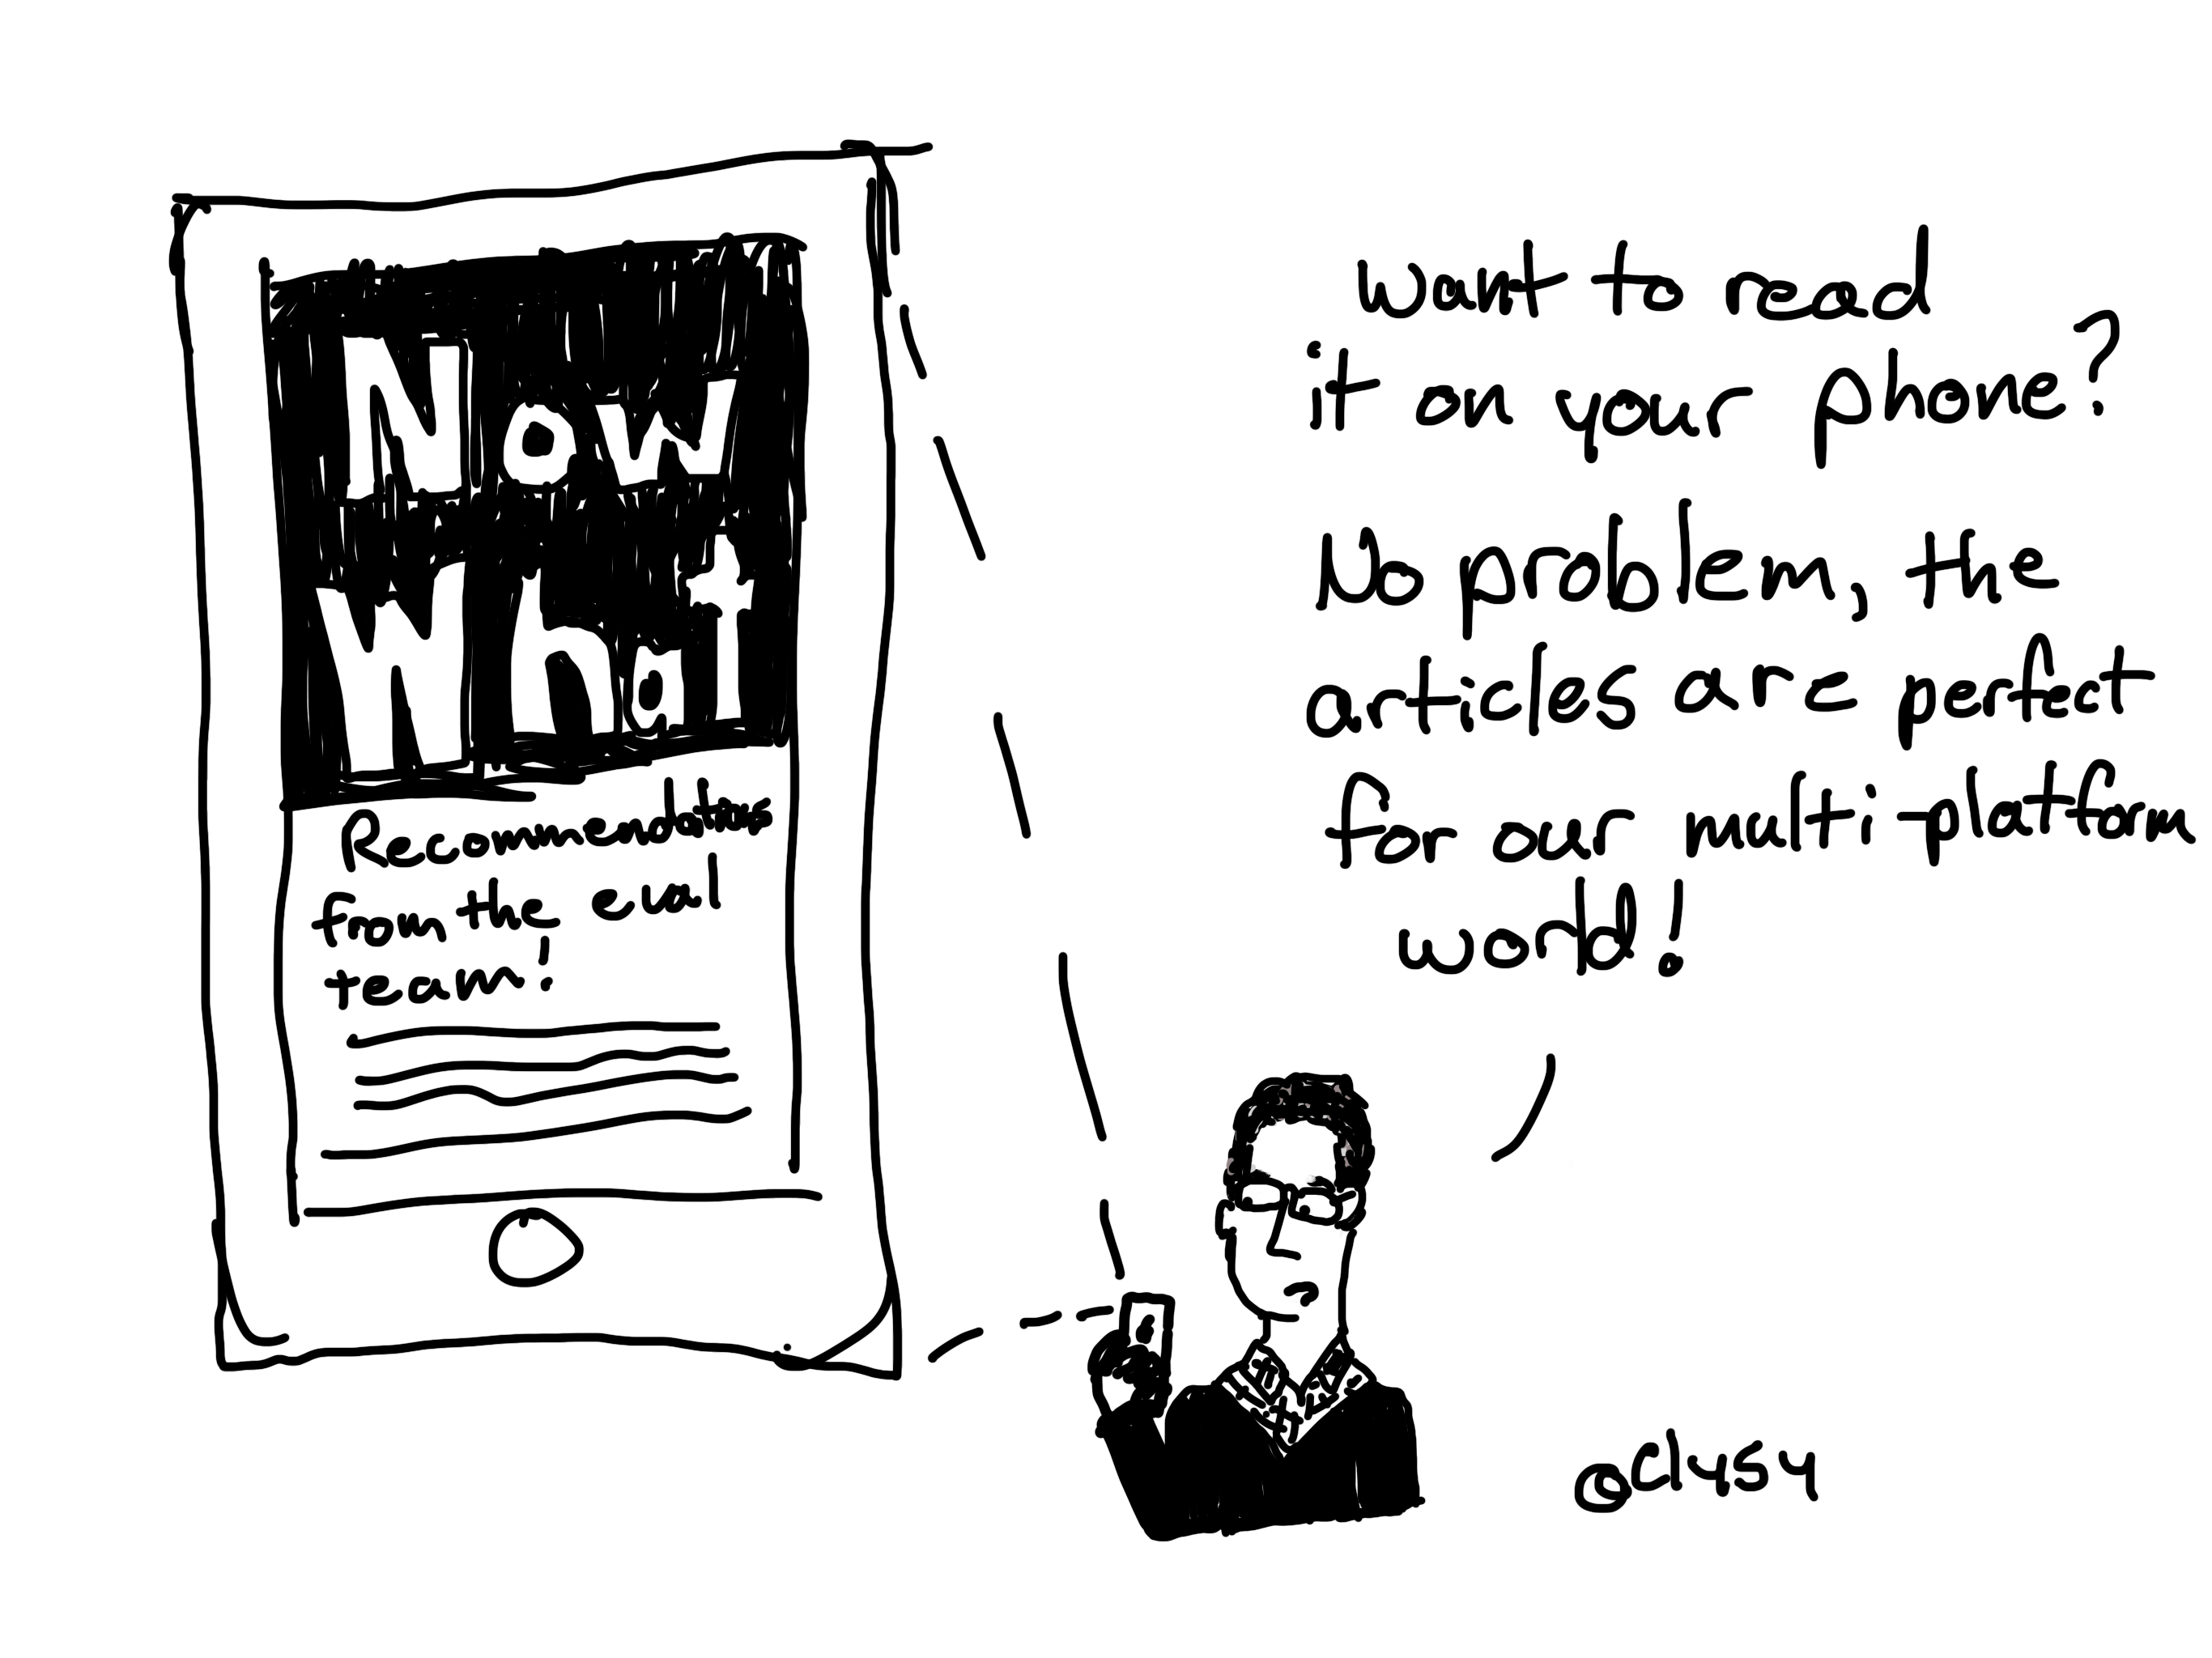
Report Design as Magazine Design [Graphic Novel Blog Post]
So what if you created reports the same way publishers created magazines? That’s the question behind today’s post. Here is a link to Canva magazine templates. Things to keep in mind when using Canva for this kind of report writing. Magazine templates are shown as covers. But many have internal spreads as well (article templates). […]

Rejecting the Null [graphic novel blog post]
Being a change maker is hard. Consider today’s graphic novel post a quick theoretical action guide.

Chart Guide: Dot Plots [graphic novel blog post]
A bar chart and a scatter plot had a little baby. In this short graphic novel guide I’ll walk you through dot plots, why they exist, and how to use them. Want more step by step Excel instructions? Stephanie has a couple of good guides: https://stephanieevergreen.com/easy-dot-plots-in-excel/ https://stephanieevergreen.com/dumbbell-dot-plot/

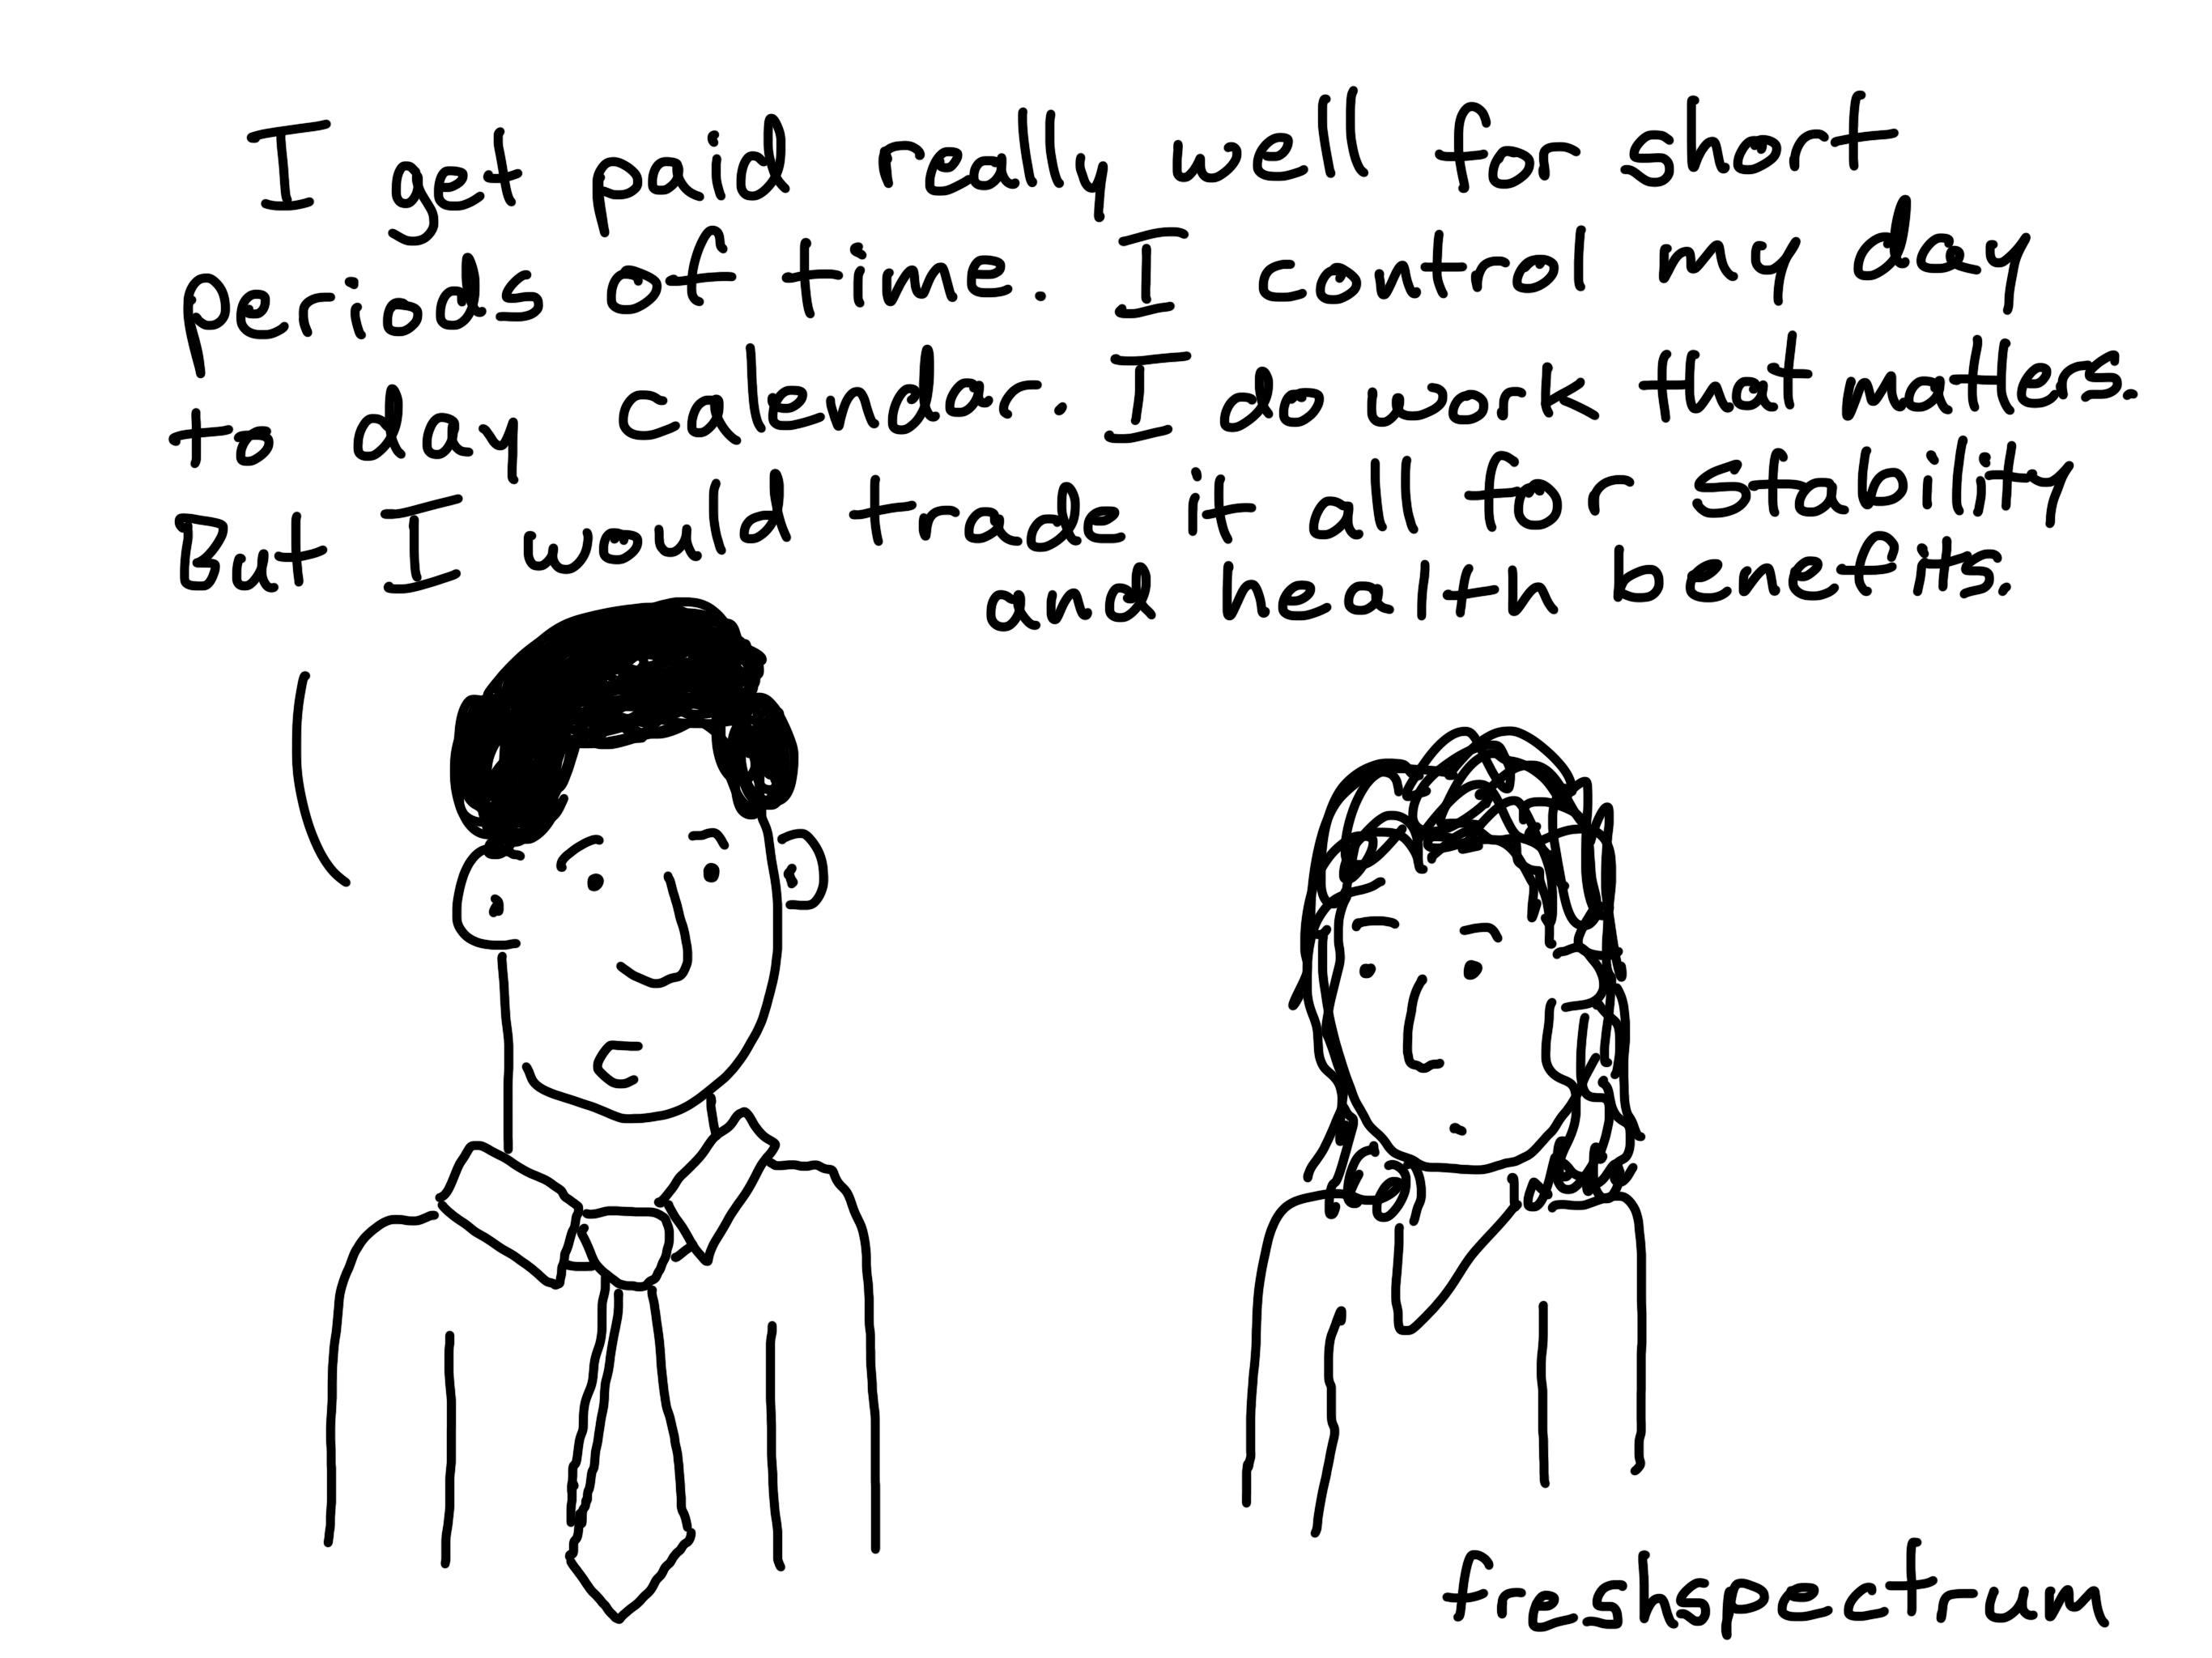
Confession Time: I’m not a reader [graphic novel blog post]
In today’s graphic novel blog post I talk about the underlying challenge that drives my work.

Chart Choosing Advice [Graphic Novel Blog Post]
If we chose clothing the way we chose charts, we would all look the same. How dull. My contention, there is no single right chart or wrong chart, that said, here is how I go about choosing. So, if I were to create a bunch of these types of lessons and put them together into […]

Rule 1: Everyone is Overwhelmed [Graphic Novel Blog Post]
Understanding context is important when designing, with or without data. And overwhelm is an almost universal challenge in our oversaturated contemporary digital culture. Did you like the graphic novel blog post? Love to know what you think as this might become a “thing.”

Chart Practice: Why did Salesforce acquire Tableau?
Look, I’m going to tell you a secret. There is really only one true way to become a better data visualization expert… …ready? PRACTICE!!! I get asked a lot for tips on finding interesting things to visualize and the process I use to create my charts and other visualizations. And yes, I am certainly full […]

I just presented at #eval19 from a thousand miles away…
11:25 AM Eastern Time – Text from Stephanie Evergreen Full house for your session. Is your co-presenter still coming? Ugh!!! I totally cancelled that a long time ago with AEA. So Crystal isn’t coming? Right. Is there a projector? Maybe you can feed me in. 5 minutes notice, no preparation… So I originally planned to […]

Cartoon Q&A: Anna Kirkland Smith on Challenges for Women in the Data Industry
Today’s Q&A is with Anna Kirkland Smith founder of the Data Scientista Society located here in the research triangle, NC. I only asked Anna one question, but her response definitely inspired a couple new cartoons. Plus I think many of you will be able to relate. What do you think is the biggest challenge for […]

Cartoon Q&A: Shelbi Fanning of Cloud Giants on Modern Marketing Challenges
So I’m kicking off a new series of cartoon Q&As. Basically I ask a few questions to practicing researchers, marketers, evaluators, designers, and communicators, then cartoon illustrate their answers. This week’s Q&A is with Shelbi Fanning who is the marketing manager at Cloud Giants, a Salesforce consultancy headquartered here in Durham, NC. How do you […]