Theory of Use Consulting
Want to get more value out of your reporting? It’s time to take action.
Theory of Use Sprints
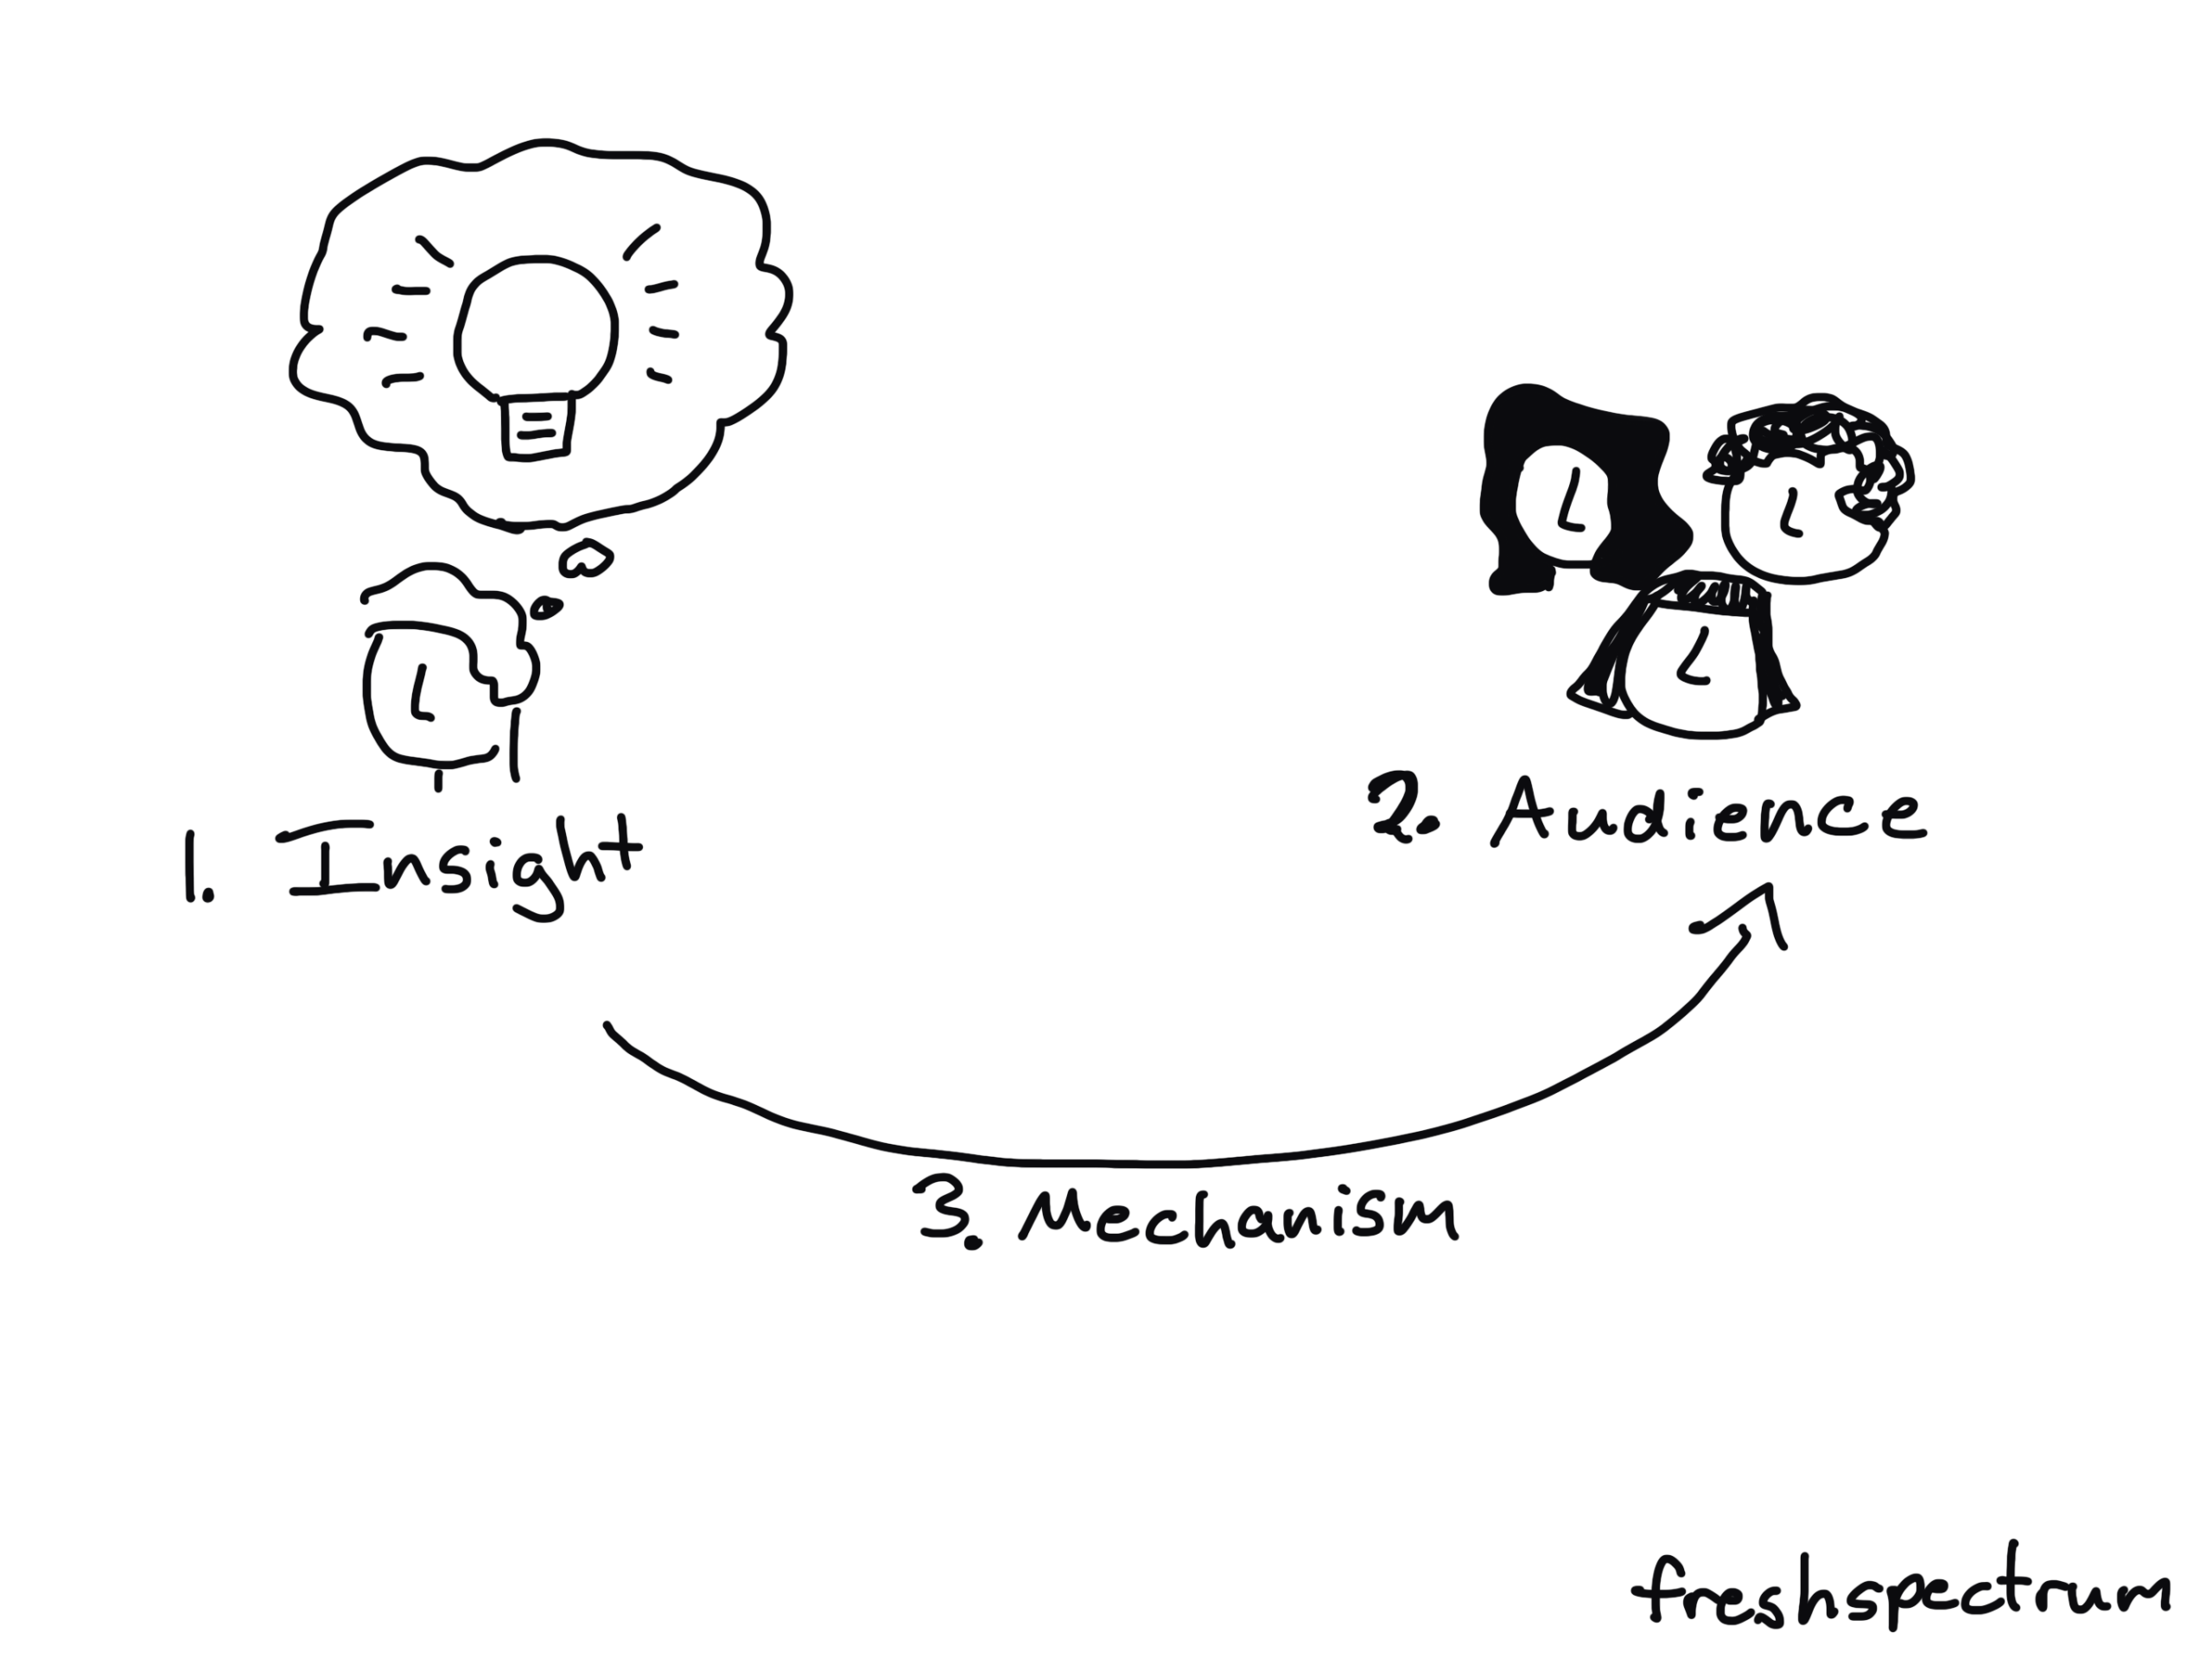
Have an important technical report or resource that just isn’t getting the attention it deserves? With a Theory of Use sprint I’ll work with your team to apply the framework focusing on a single resource. We’ll identify the most important insights, think through your specific audiences, and come up with a set of mechanisms in order to adapt your technical work into actionable resources. (Sprints start at $10K).
Theory of Use Transformation
Want to fully transform how your team approaches reporting? We’ll take a deep dive into your current reporting habits, creative capacity, reporting strengths, and blind spots. Then we’ll build a comprehensive repeatable dissemination strategy utilizing my Theory of Use framework.
Following that we’ll develop a set of custom report templates and AI prompts using the tools your team is most comfortable using (Canva, PowerPoint, Google Docs, Claude, Gemini, etc.). We’ll then put together a professional development plan to bring your whole team on board. (Transformations start at $25K).
Book a Free 30 Minute Consult See Workshops OfferedTrusted by researchers, public health officials, and evaluators at top foundations, NGOs, government agencies, and non-profit organizations across the globe.
Workshops
Hands-on private and public virtual workshops for evaluation, research, public health, and non-profit teams.
Is This Your Team?
- You have a team full of experts who know data, but struggle with design: You produce long, text-heavy PDFs because no one was ever trained on graphic design, illustration, or digital copywriting.
- You assume design takes too much time or money: You think you need complex, expensive software or dedicated graphic designers to make a report look modern.
- Your reports sit on digital shelves: You spend months collecting data, only for the final deliverable to receive zero engagement or questions.
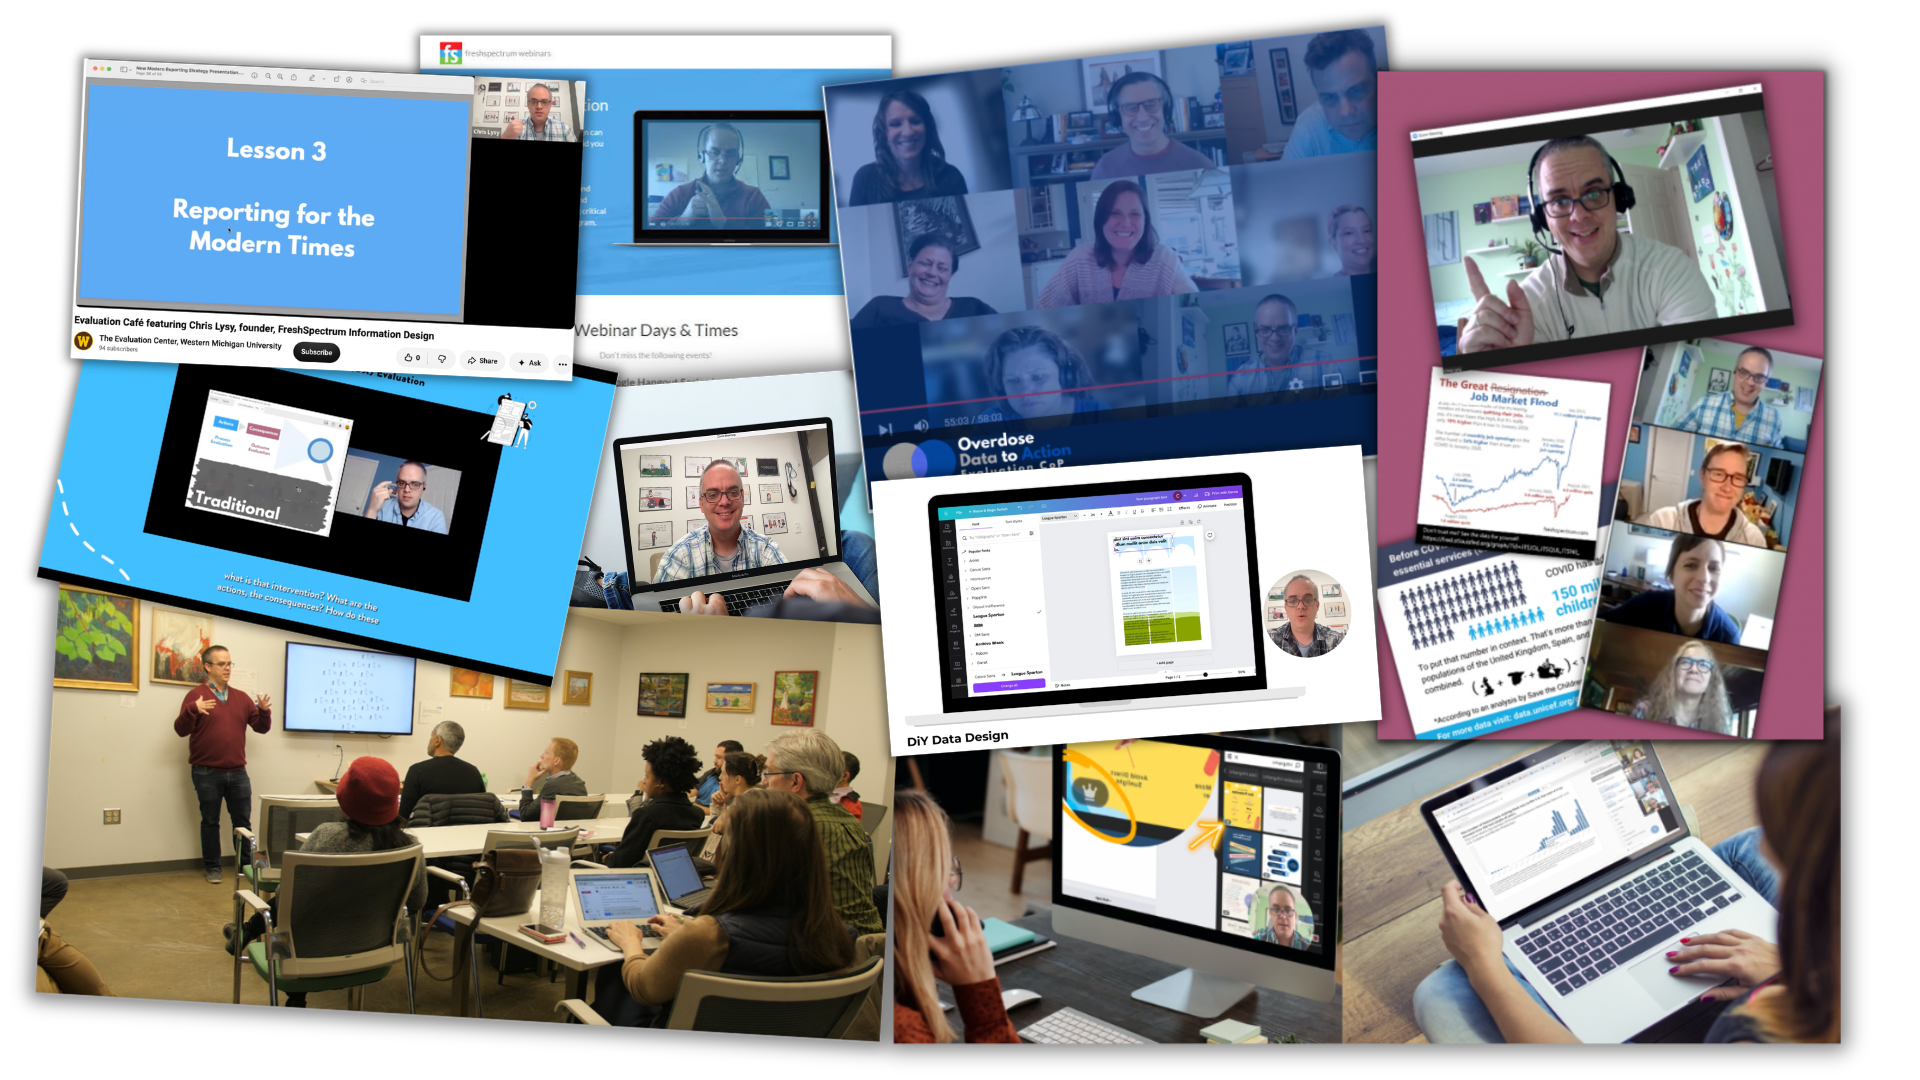
The Fix: Stop reporting like it’s 1999. Move away from relying on a single, massive PDF to do all the work. Together we build simple creative systems so your team can consistently produce visual, human-centered reports.
The 4 Core Workshop Tracks
Offered privately for teams & through scheduled public sessions for indivduals.
1. Everyday Visual Reports
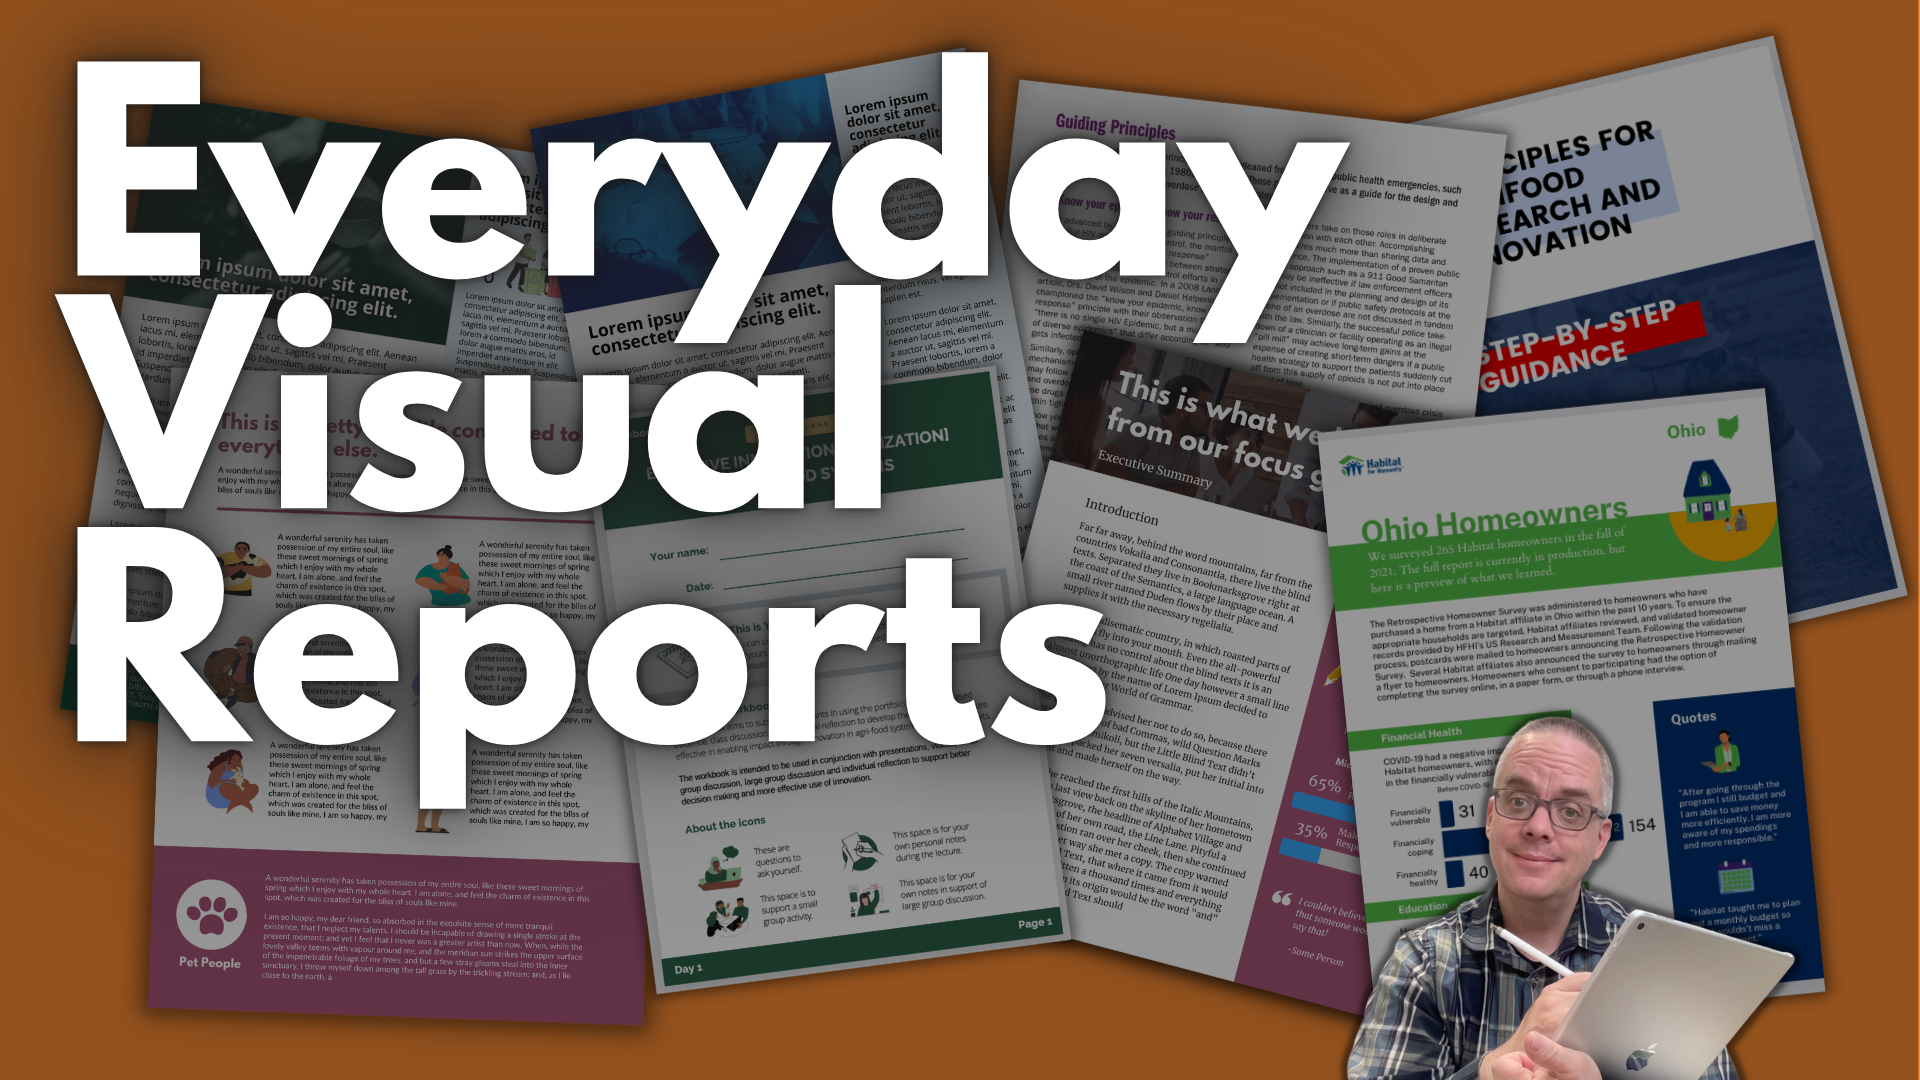
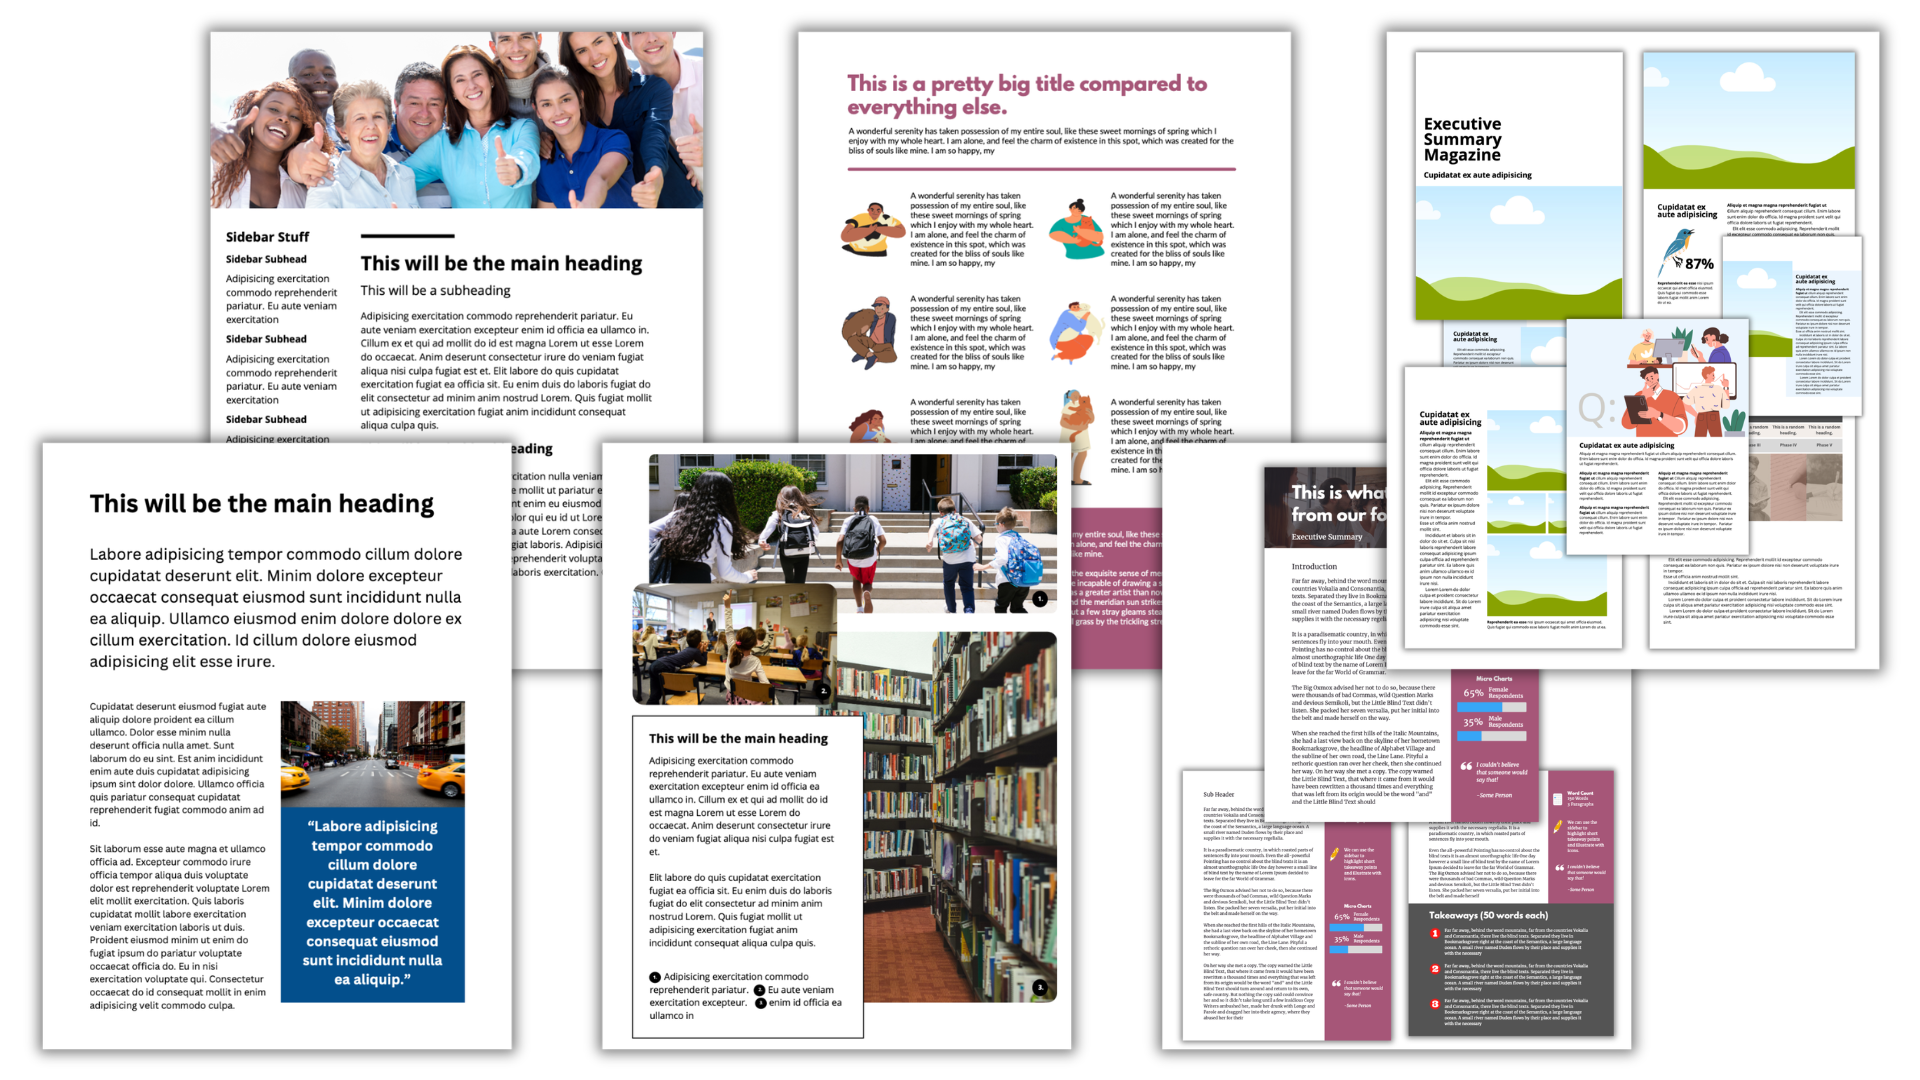
Learn how to design and structure short, high-impact visual reports—including one-pagers, infographics, blog posts, and slidedocs. Taught using Canva (and/or PowerPoint).
2. Compelling Qualitative Data Visualization
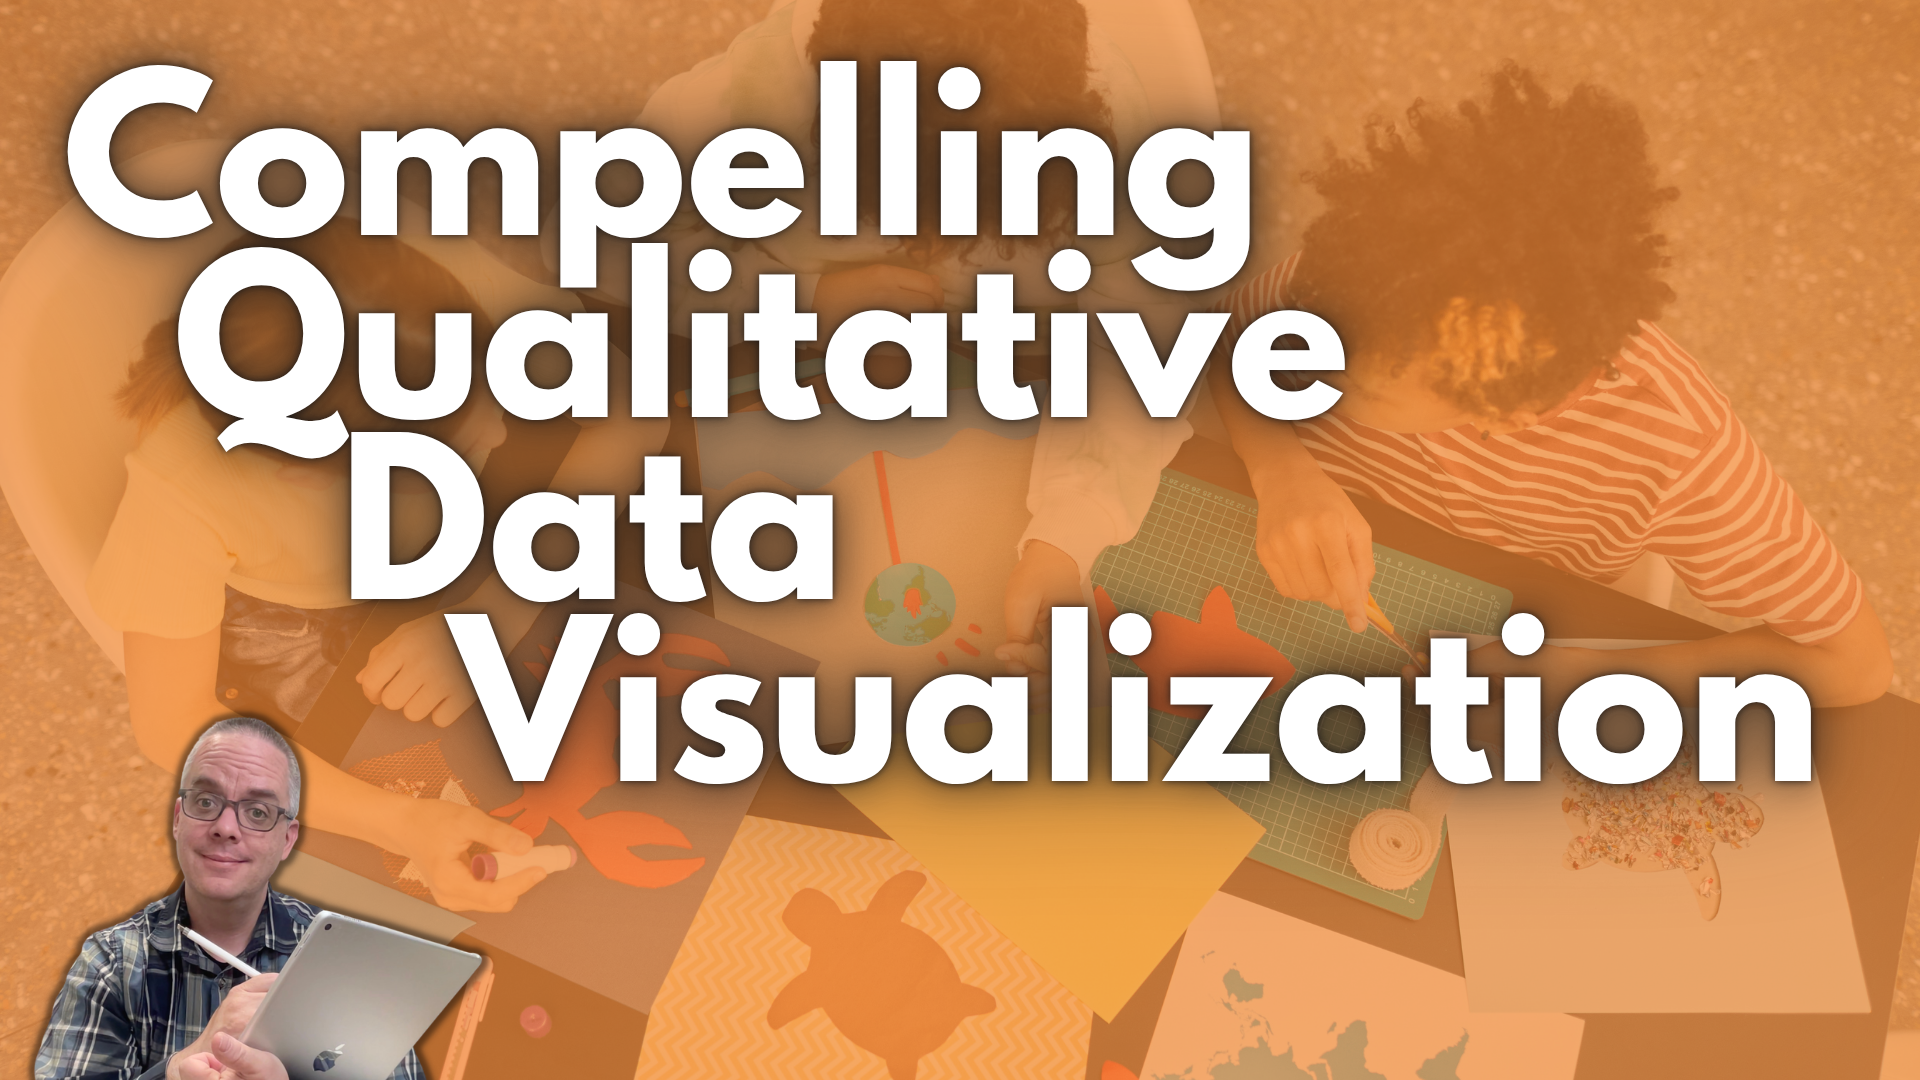
Move beyond word clouds with my practical illustration framework. Learn simple techniques that make text-heavy qualitative findings accessible.
3. Effective Data Storytelling
Discover narrative frameworks that weave data into memorable stories, helping your insights resonate with decision-makers.
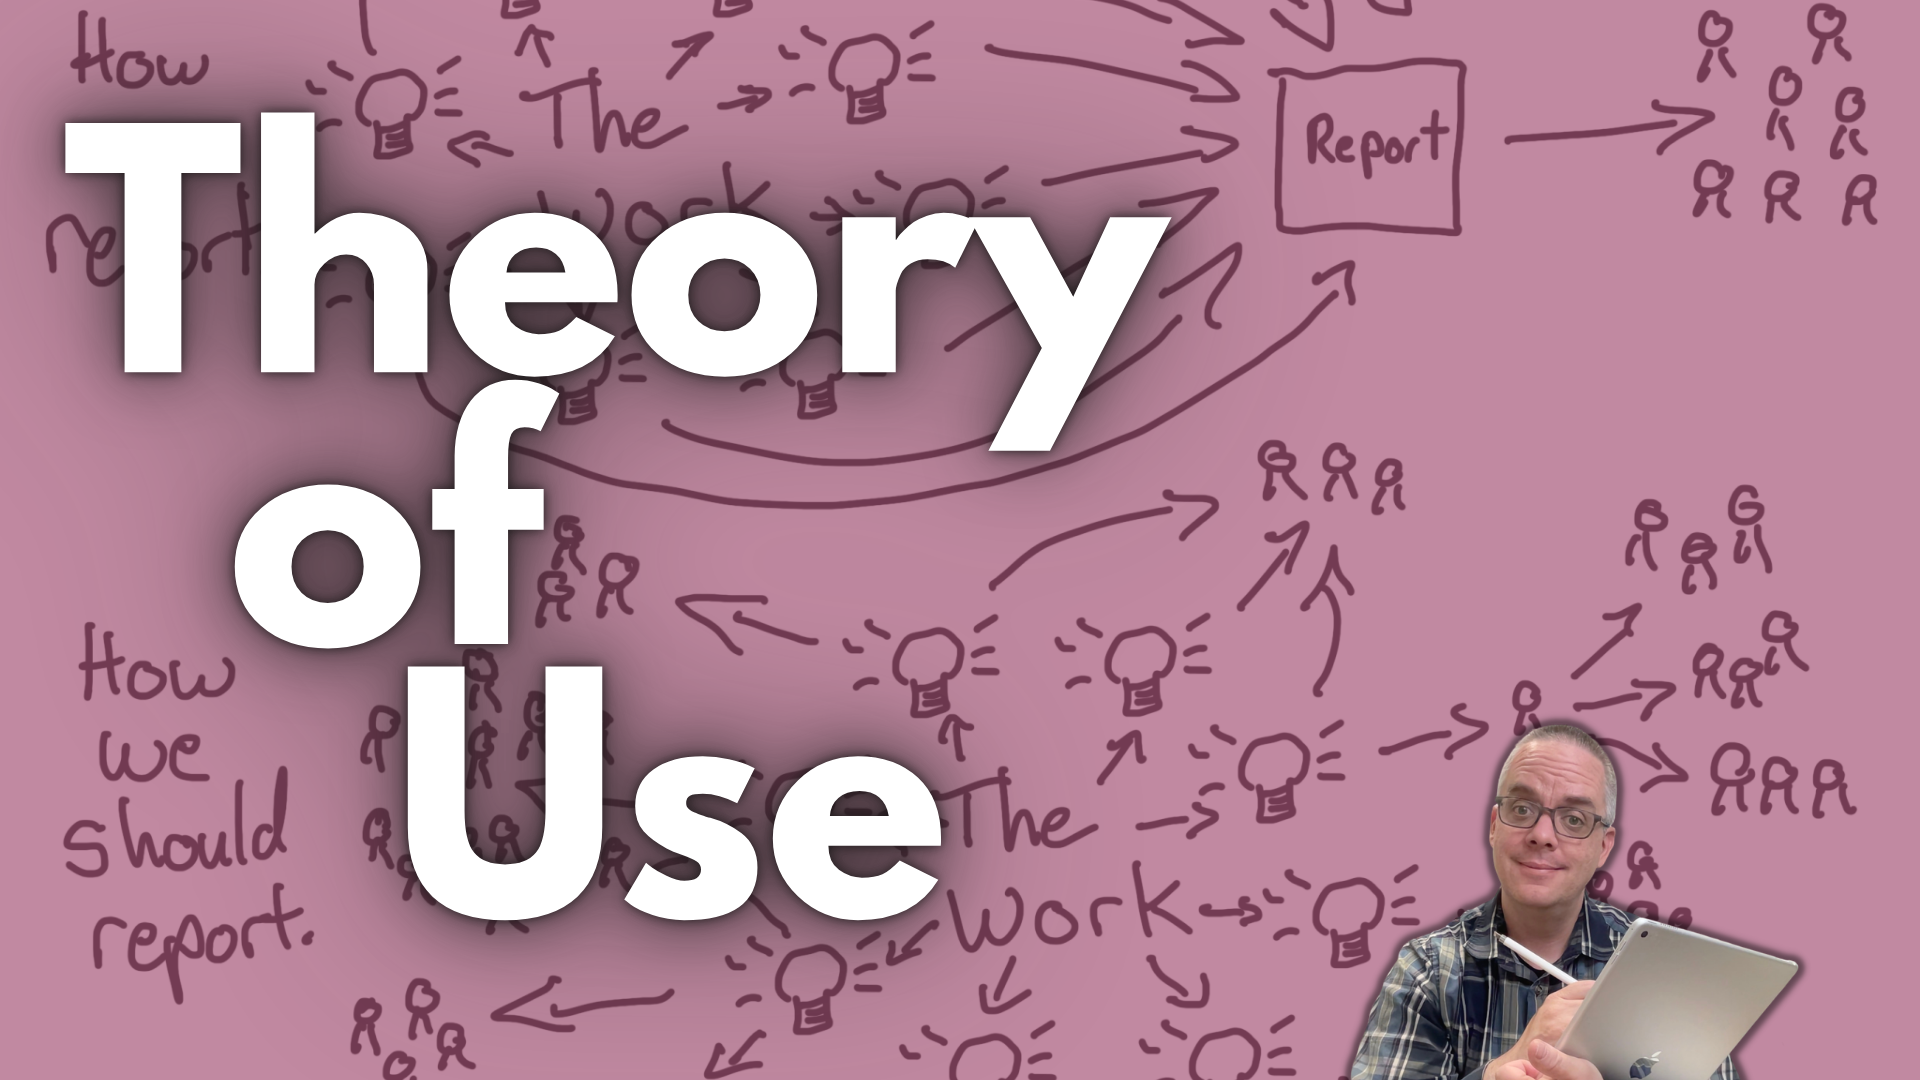
4. Theory of Use
Stop treating dissemination as an afterthought. Build a measurable digital strategy using my practical Theory of Use framework.
Private Virtual Team Workshops (B2B)
All team workshops are taught live via Zoom (or your preferred platform). Built around interactive delivery, every participant receives forever access to session recordings and custom workbooks/templates.
| Package Tier | Pricing & Group Size | Key Features Included |
| Tier 1: Quick Start 1 Core Topic | $3,000 Up to 10 Participants | • One 90-min Live Session • 30-min Live Q&A • Google Drive Workbook |
| Tier 2: Deep Dive (Flagship) 1 Core Topic | $5,000 Up to 25 Participants | • Two 90-min Live Sessions • 60-min Participant Show-and-Tell Session • Google Drive Workbook + Canva & PowerPoint Templates |
| Tier 3: Transform 2 Core Topics (Pick 2 Tracks) | $8,500 Up to 25 Participants | • Four 90-min Live Sessions • Two 60-min Participant Show-and-Tell Sessions • Google Drive Workbook + Canva & PowerPoint Templates |
Individual Virtual Workshops
Don’t have a full team to train? Join our single-seat cohort format designed for solo researchers, evaluators, and freelancers using individual professional development funds. My goal is to hold one a month, depending on demand. The next scheduled sprint is listed below, a waitlist for each is always open and helps to determine which workshop to hold next.
- Everyday Visual Reports (Join the Waitlist) [Next Sprint: TBD]
- Compelling Qualitative Data Visualization (Join the Waitlist) [Next Sprint: TBD]
- Effective Data Storytelling (Join the Waitlist) [Next Sprint: TBD]
- Theory of Use (Join the Waitlist) [Next Sprint: TBD]
Sprint Structure
3-Week Live Cohort (4 Hours Total Contact Time)
- Week 1: Core Framework & Direct Instruction (90 mins)
- Intermission: Work through a real-world project using the included Google Drive Workbook.
- Week 2: Advanced Tips & Tweaks (90 mins)
- Week 3: Participant Show-and-Tell Session (60 mins)
Pricing
- Early Bird Seat: $297 (Limited to first 10 registrants)
- Standard Seat: $397
- VIP Feedback Seat: $597 (Includes two 30 minute 1-on-1 check-in calls for feedback as you apply new skills)
What Industry Leaders Say
“Chris has a knack for capturing and communicating the essence of an idea with insight and humor. That makes his work evocative, provocative, high impact, and memorable.”
David Fetterman, President & CEO, Fetterman & Associates
“Whether the work highlights quantitative data through clear, attractive charts or focuses on qualitative visual storytelling, Chris creates inviting, engaging reports that our clients are uniformly thrilled with.”
Summer Wood, Co-Director, Ampersand LLC
“We felt much better equipped to create engaging data products after working with Chris and have received overwhelmingly positive feedback on what we have released so far.”
Kathleen Chaballa, Senior Analyst at Habitat for Humanity International
“Chris asks the right questions, brings rich expertise, and doesn’t shy away from the messiness of creative innovation. The rewarding process of co-creating with Chris is why our firm engaged him again.”
Nina Sabarre, Founder & CEO of Intention 2 Impact
Need Custom “Done-With-You” Support?
Looking for broader organizational support beyond team workshops? I also partner with teams on:
Co-Design Projects
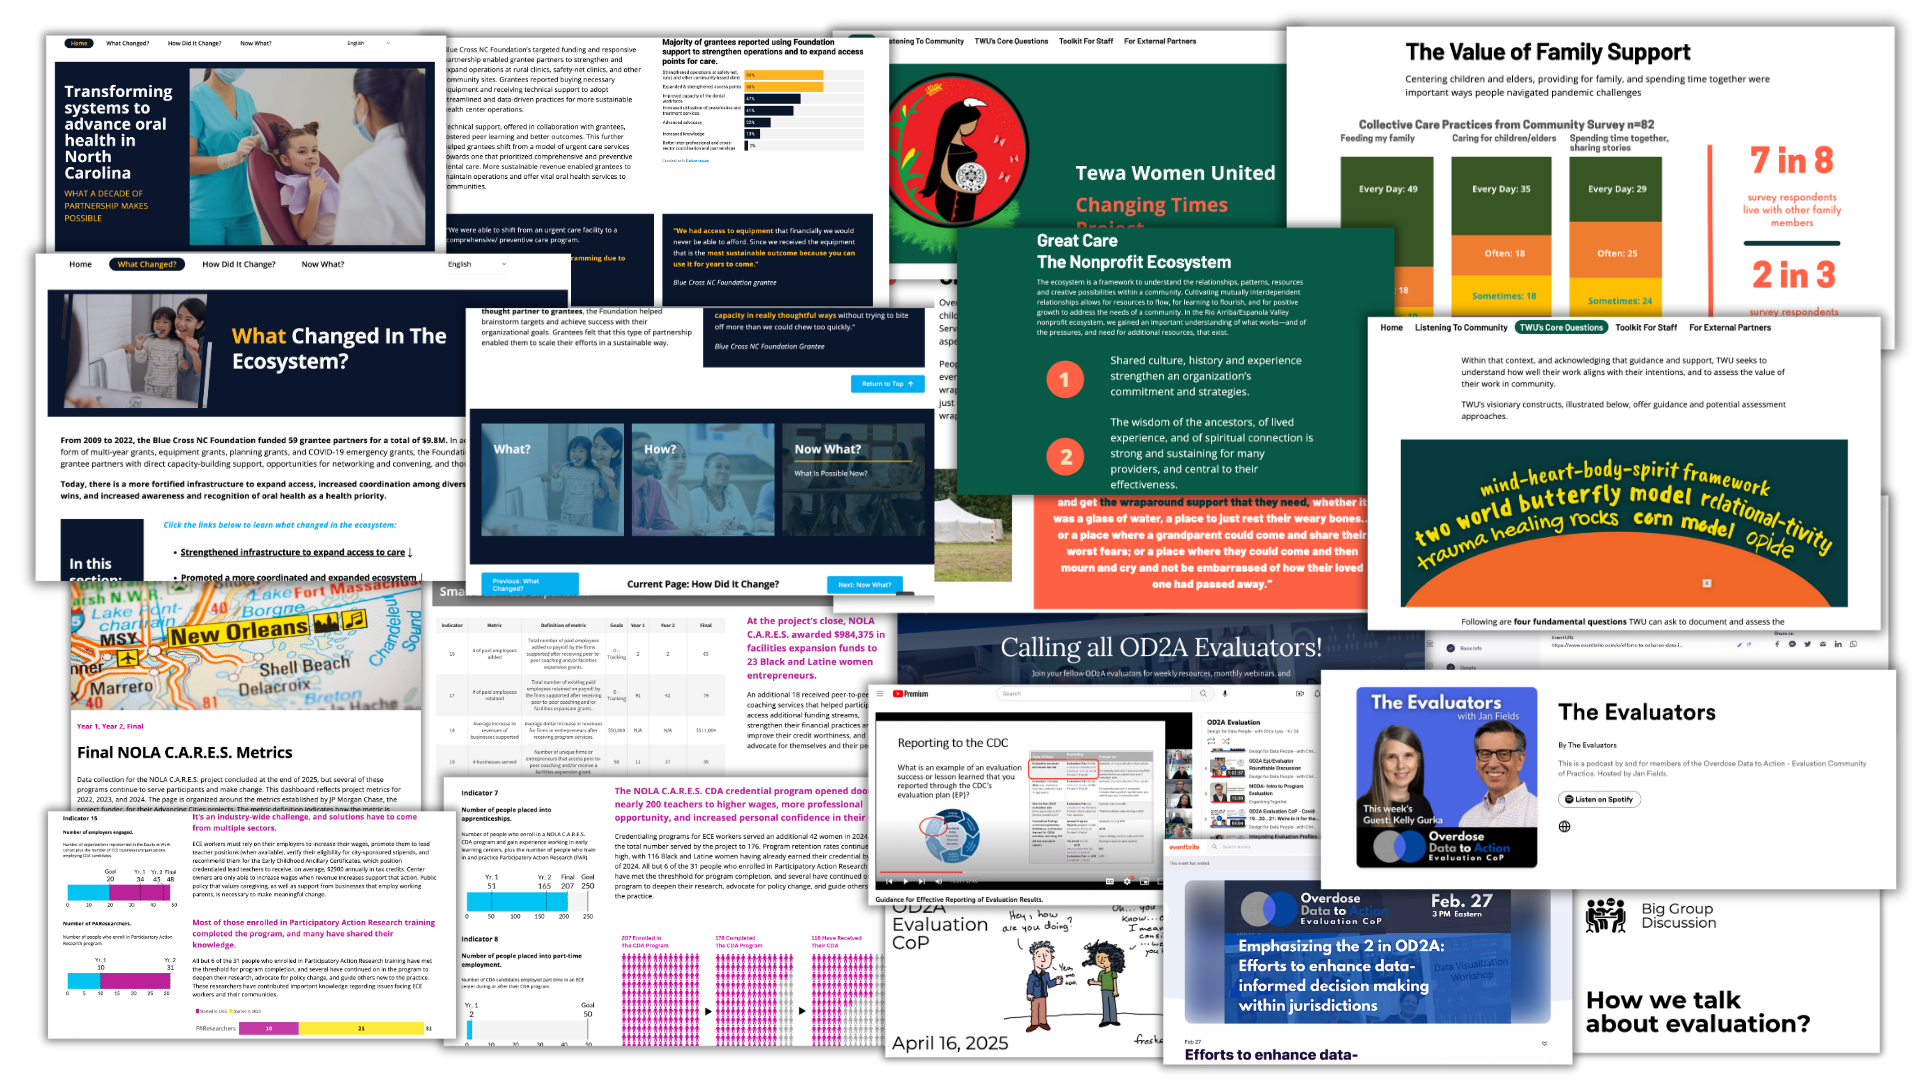
Working alongside your team over 2–3 months to develop dissemination strategies and custom report design templates.
HTML Web Report Builds
Transforming static, lengthy PDFs into interactive, highly accessible web reports.
Starting is Easy – Schedule a Free 30-Minute Consulting Call
Calendar not showing? Here is a direct link to my Calendly page.