Today’s report review took me a strange direction. What started as a simple report review ended up becoming a full working paper, but more on that shortly.
This post is in two parts:
- Part 1 – the part that shows how this report was “shared”
- Part 2 – the part that talks about the content and what I think is missing
In the US if a hospital wants to be tax exempt it has do a few things to meet IRS requirements. One of those things is a Community Health Needs Assessment (CHNA). These reports are released once every three years. There are about 3,000 hospitals across the country that pull these together, so that means about 1,000 reports a year across the US.
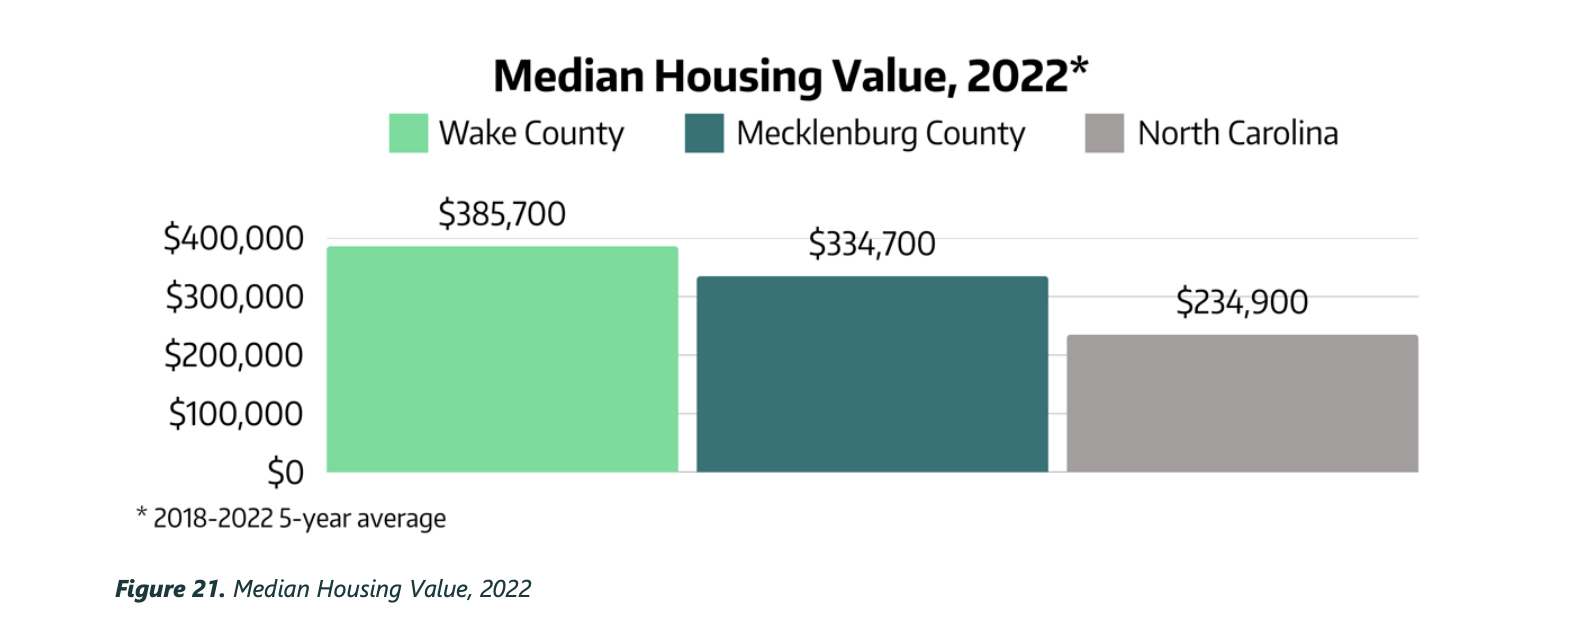
For today’s dissemination review I took a look at Wake County, North Carolina’s CHNA (mostly because it’s where I live). For those not aware of the area, our biggest city is Raleigh and Wake is the largest county in North Carolina. And yes, even though they get almost all of our pro sports teams, our county is bigger than Mecklenburg (where you’ll find Charlotte).
Part 1 – Wake County 2025 Community Health Needs Assessment
Wake County has a few different competing hospital systems. Lots of people know about the college basketball rivalry, but did you know that UNC and Duke also operate competing hospital systems. But these systems put that aside and come together (along with the public health department and other public health system partners) to build the county level CHNA report.
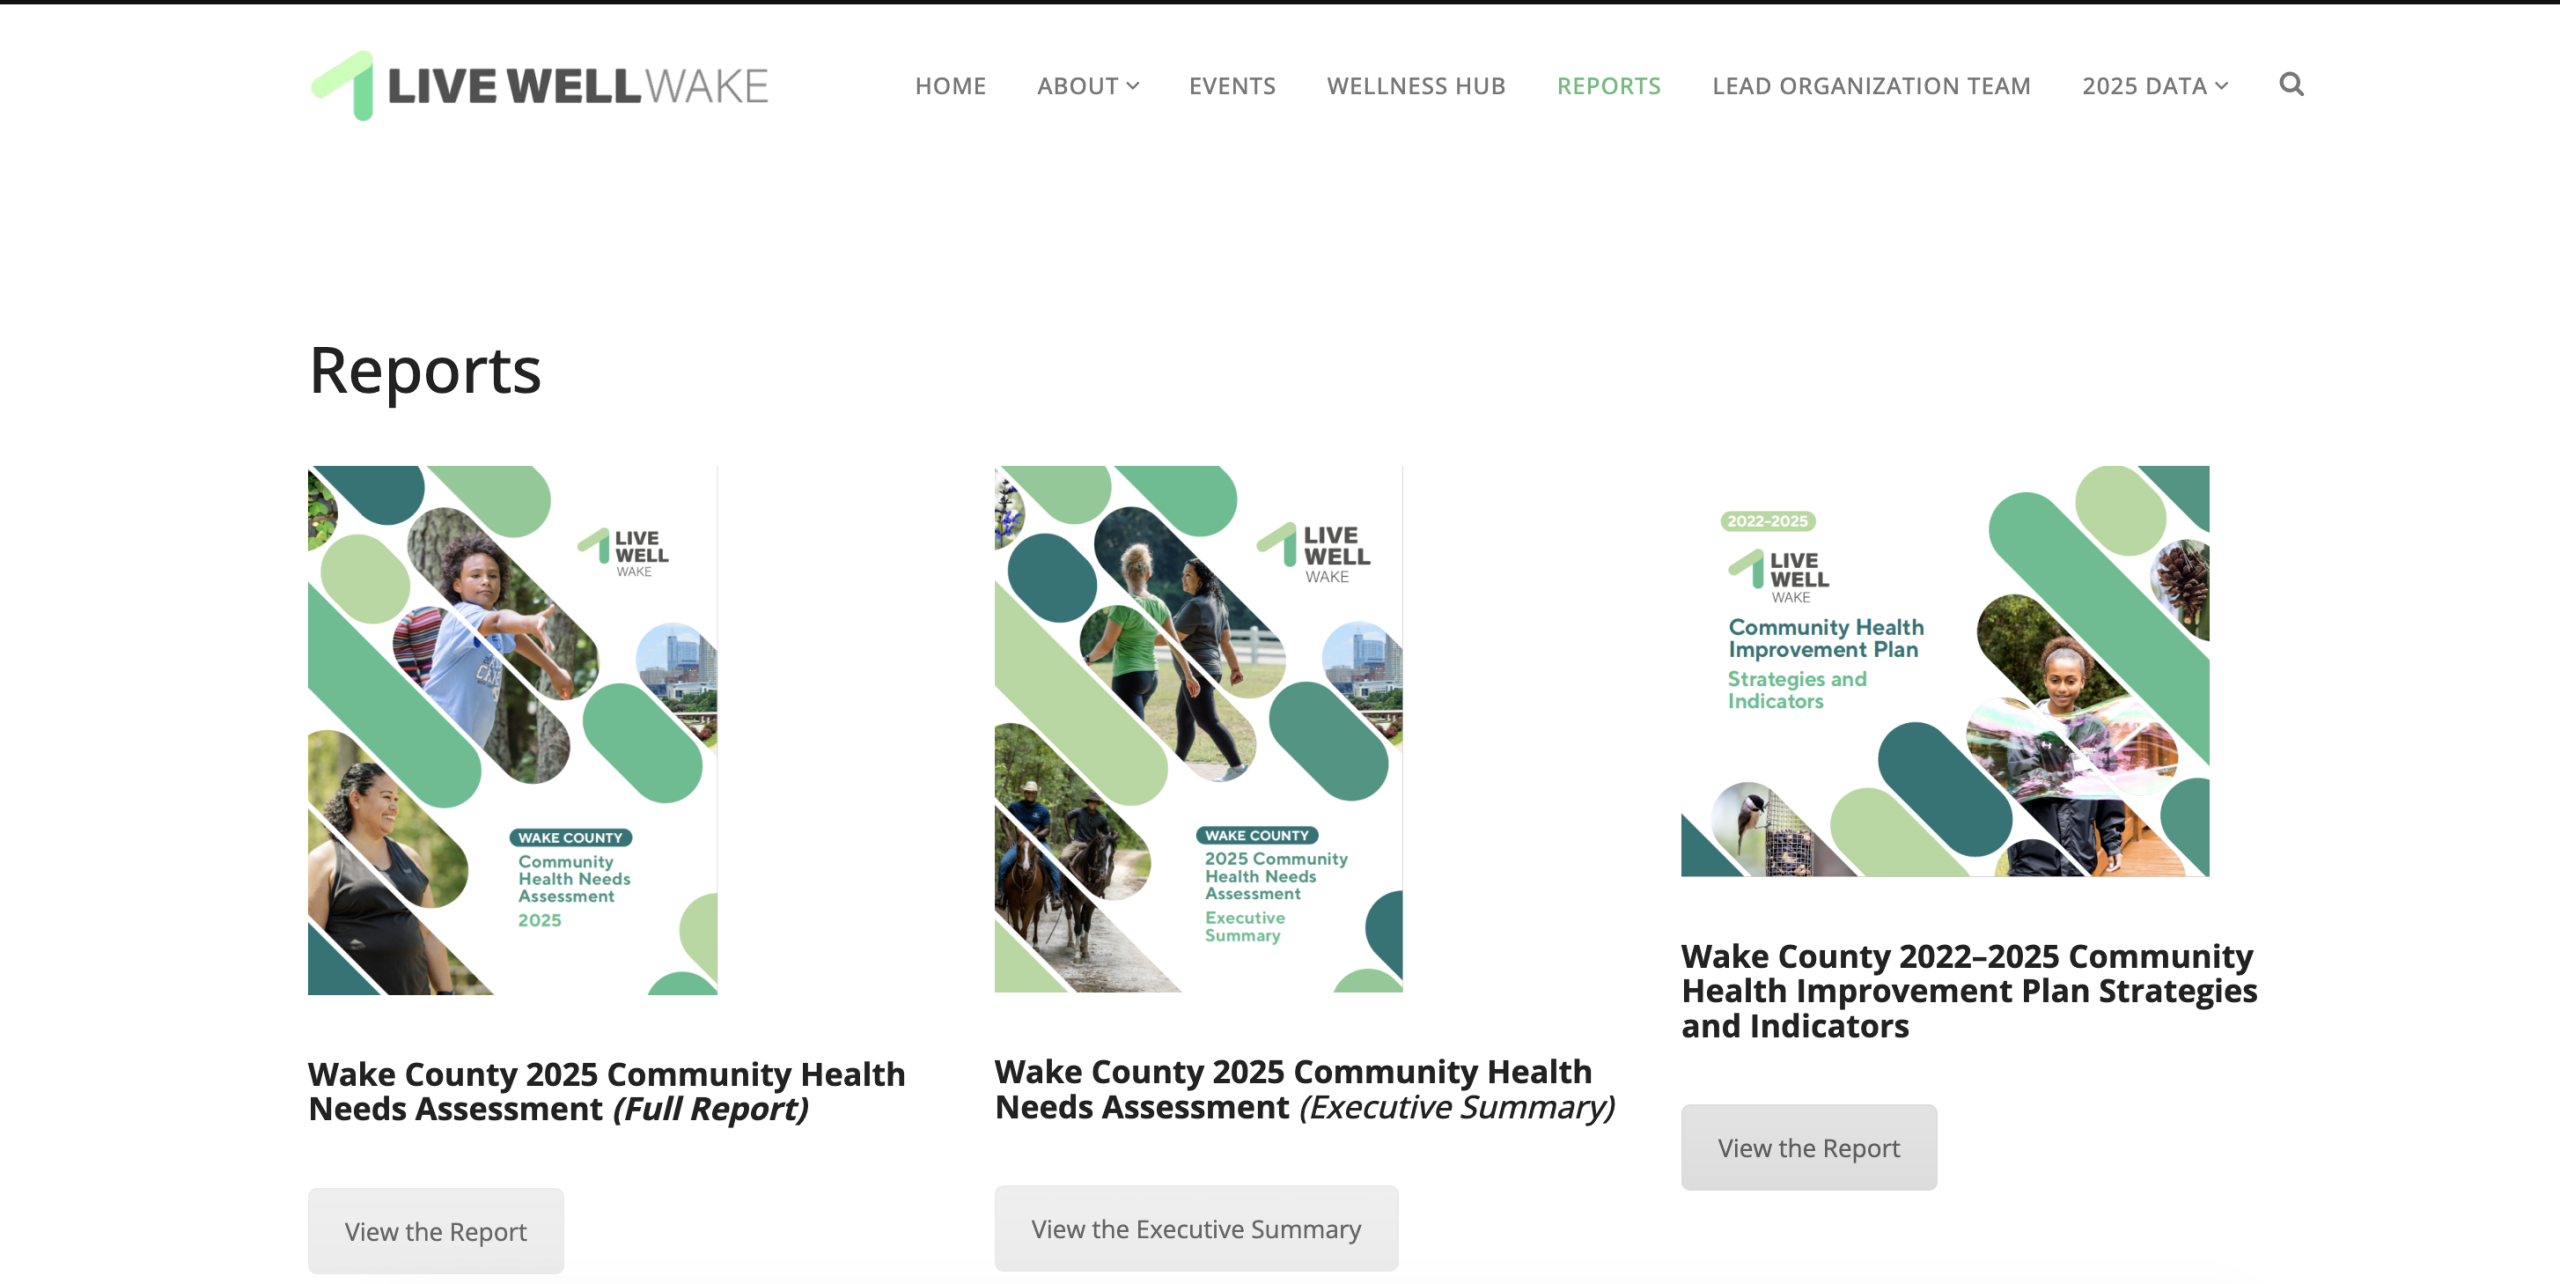
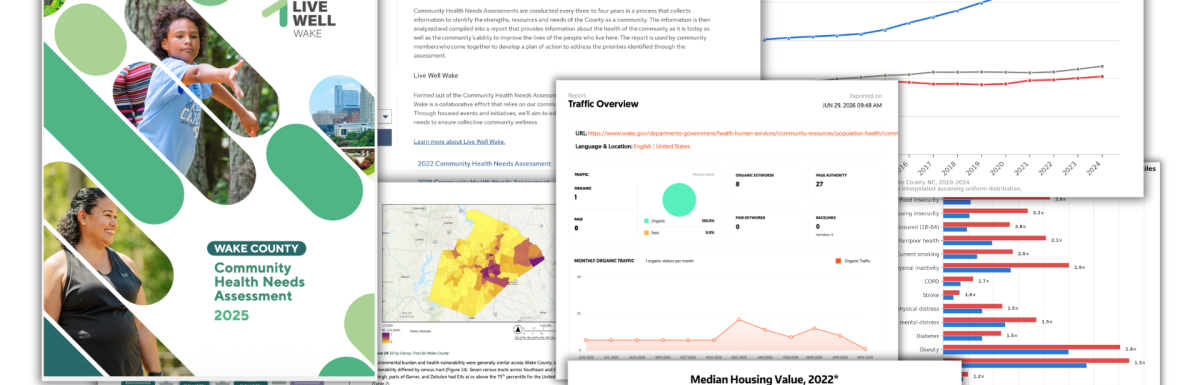
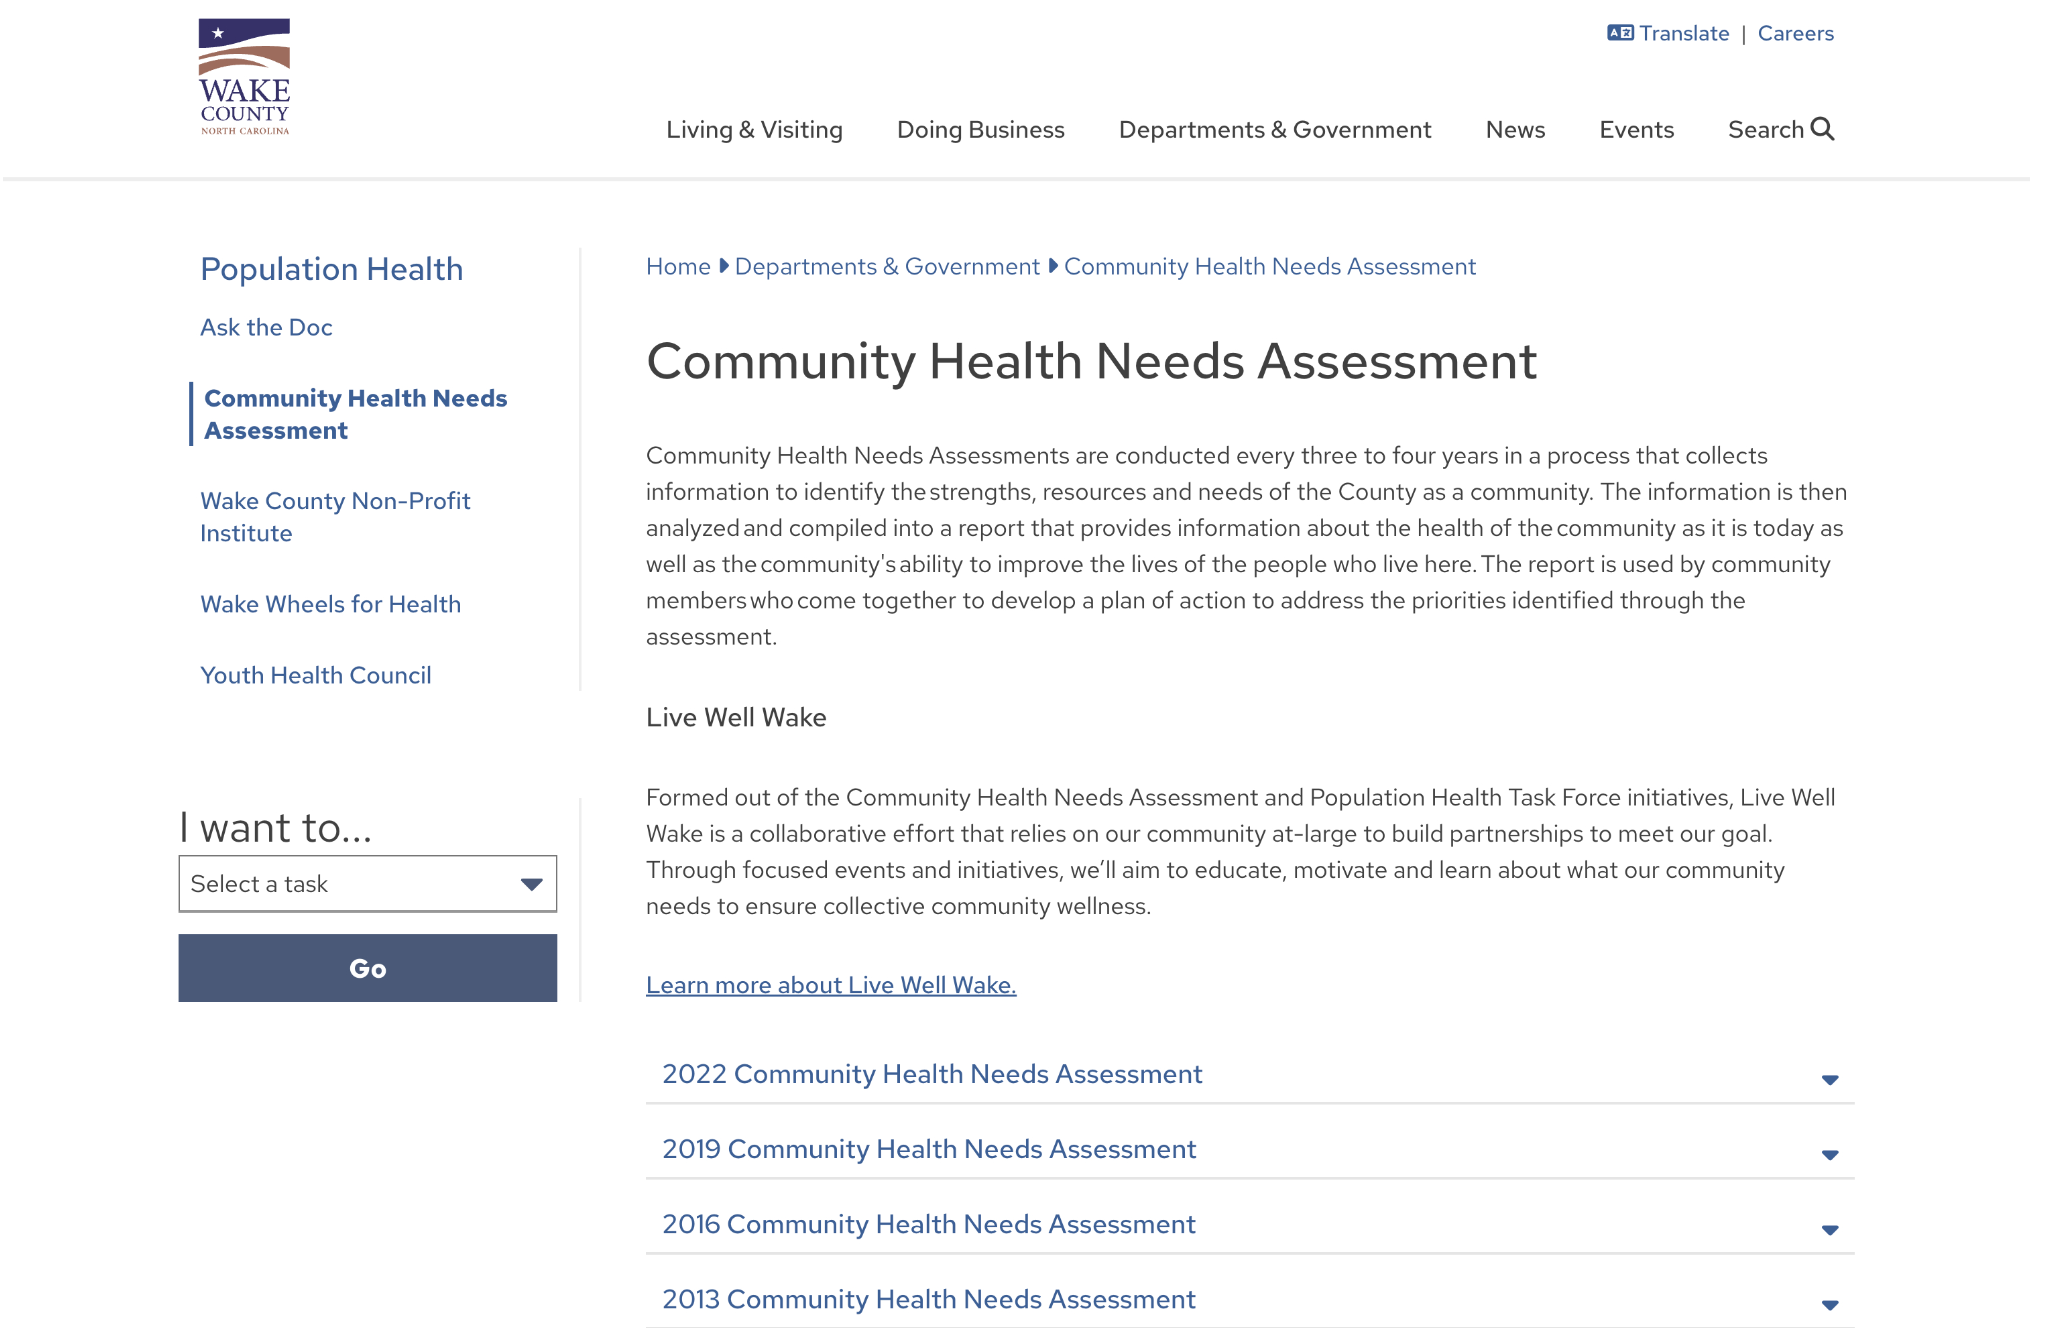
You’ll find the full report as a PDF, along with an Executive Summary and some other data links at the project’s website Live Well Wake.
This report is the combined effort of organizations with annual operating budgets in the billions of dollars. The WakeMed hospital system alone has annual operating cost of around 1.7 billion dollars. Added together, we’re probably talking about around 5 billion dollars a year across the different systems.
So the website is clean. The PDF report is professionally designed. And the experts behind the report are at the level you would expect.
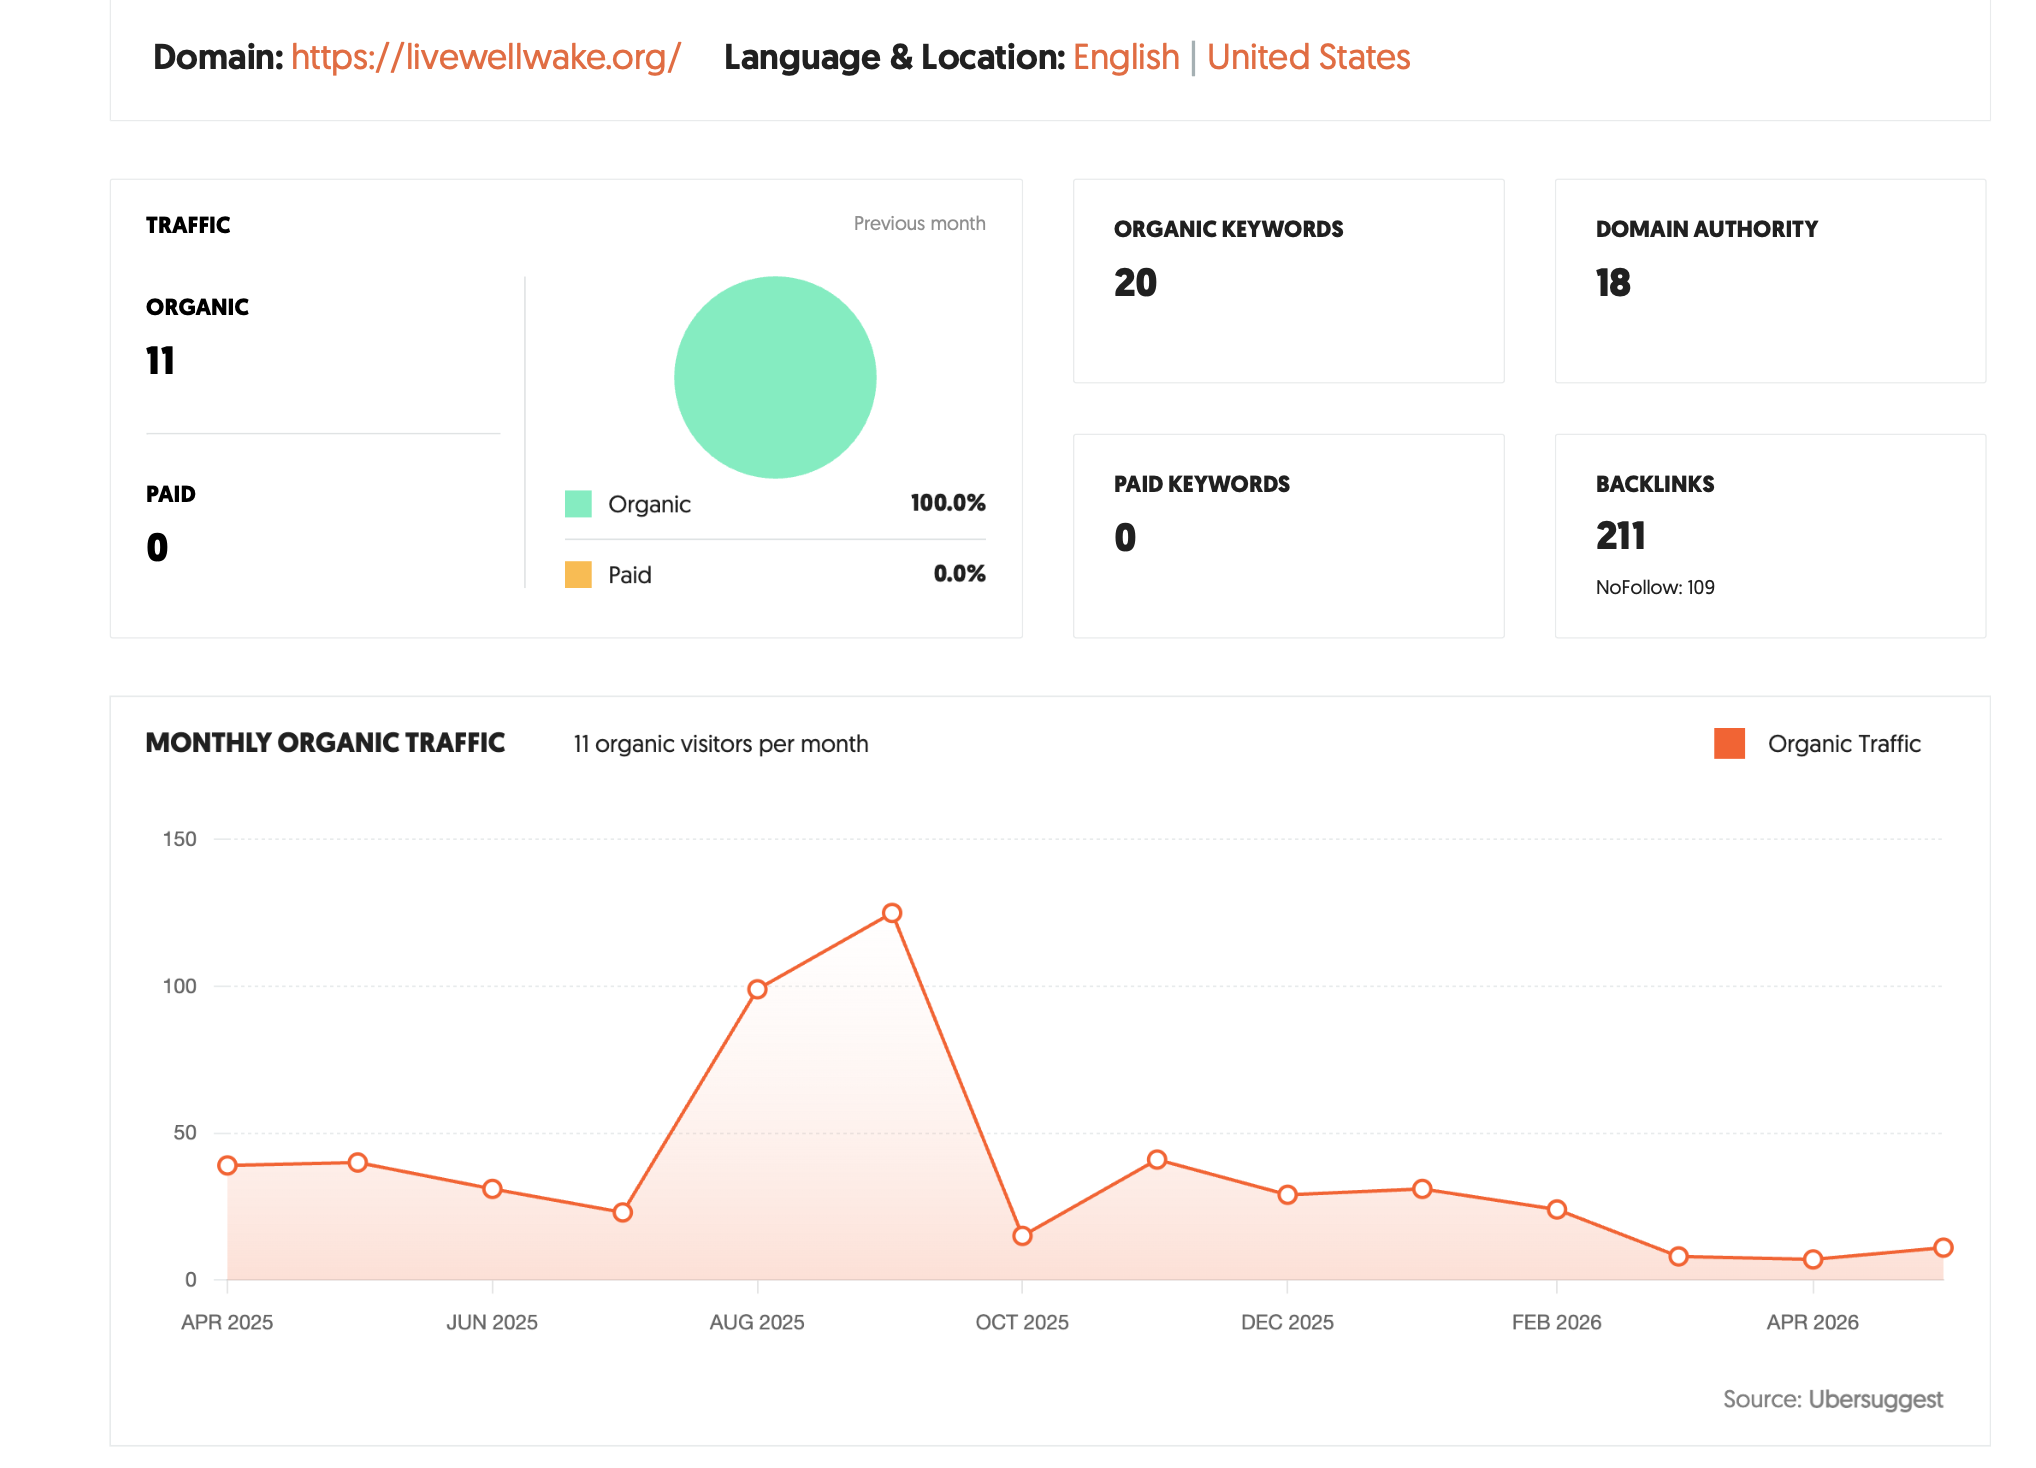
What the search data shows…nothing good.
Looking behind the curtain, most things sit on a website that gets hardly any actual search traffic.
Now that’s not the only place you’ll find the report. It can also be found directly on some of the hospital sites and the Wake County government site. None of these sites get any meaningful level of traffic either.
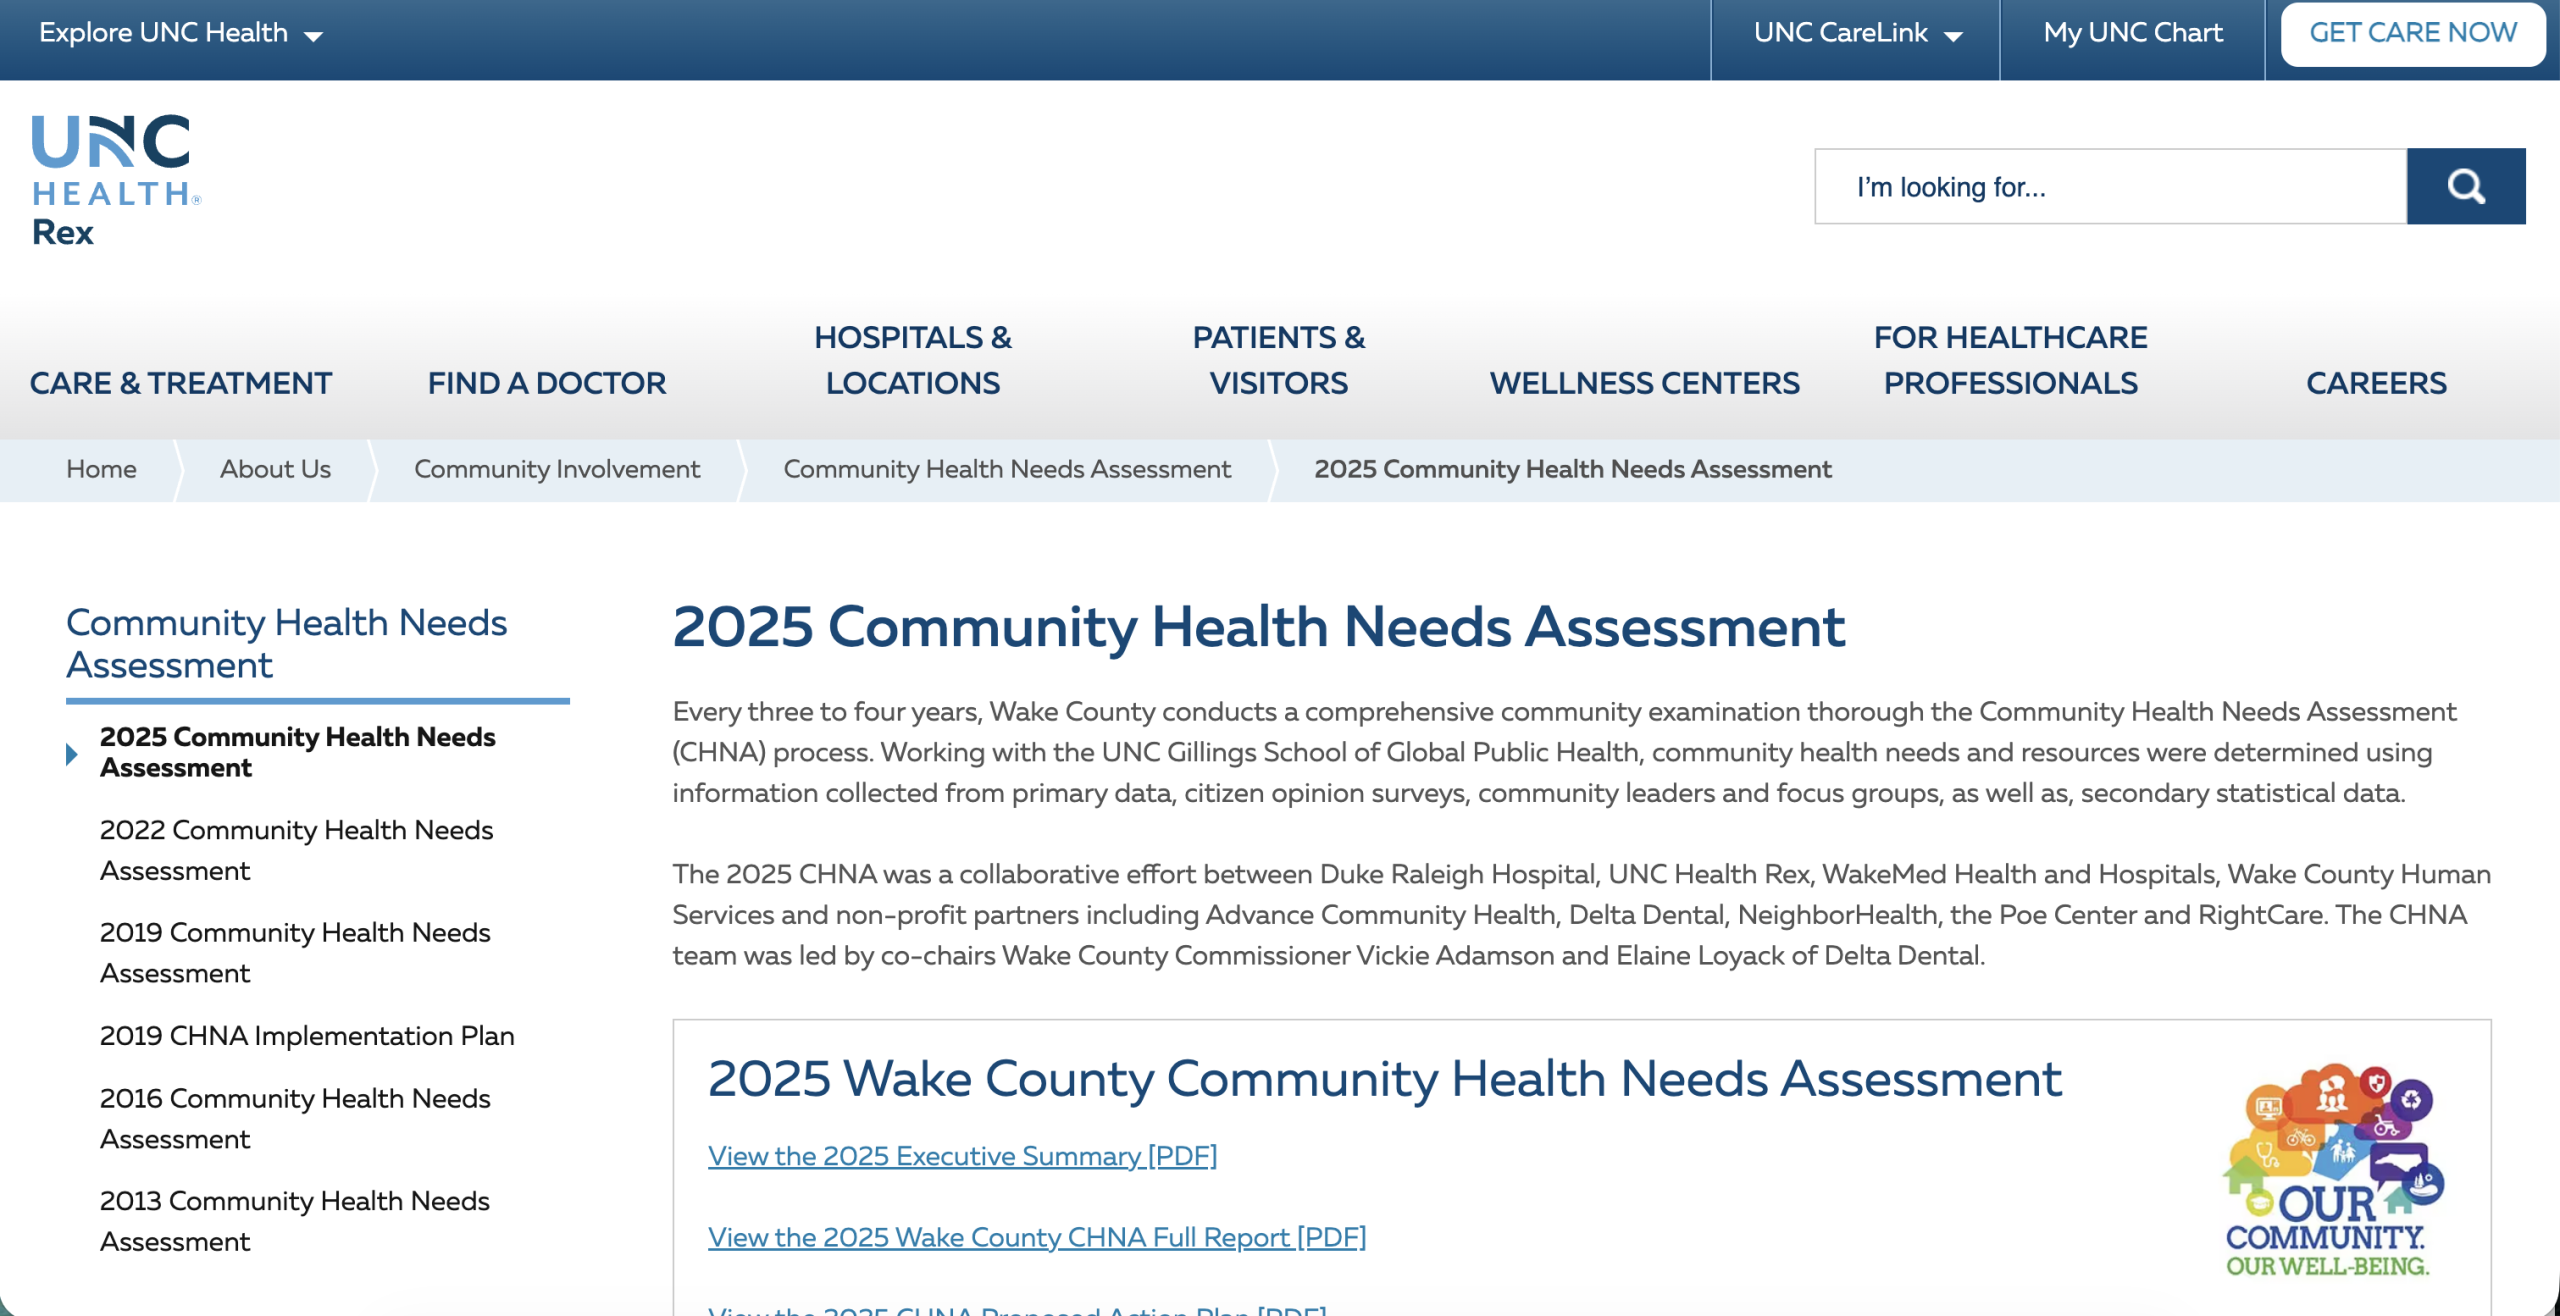
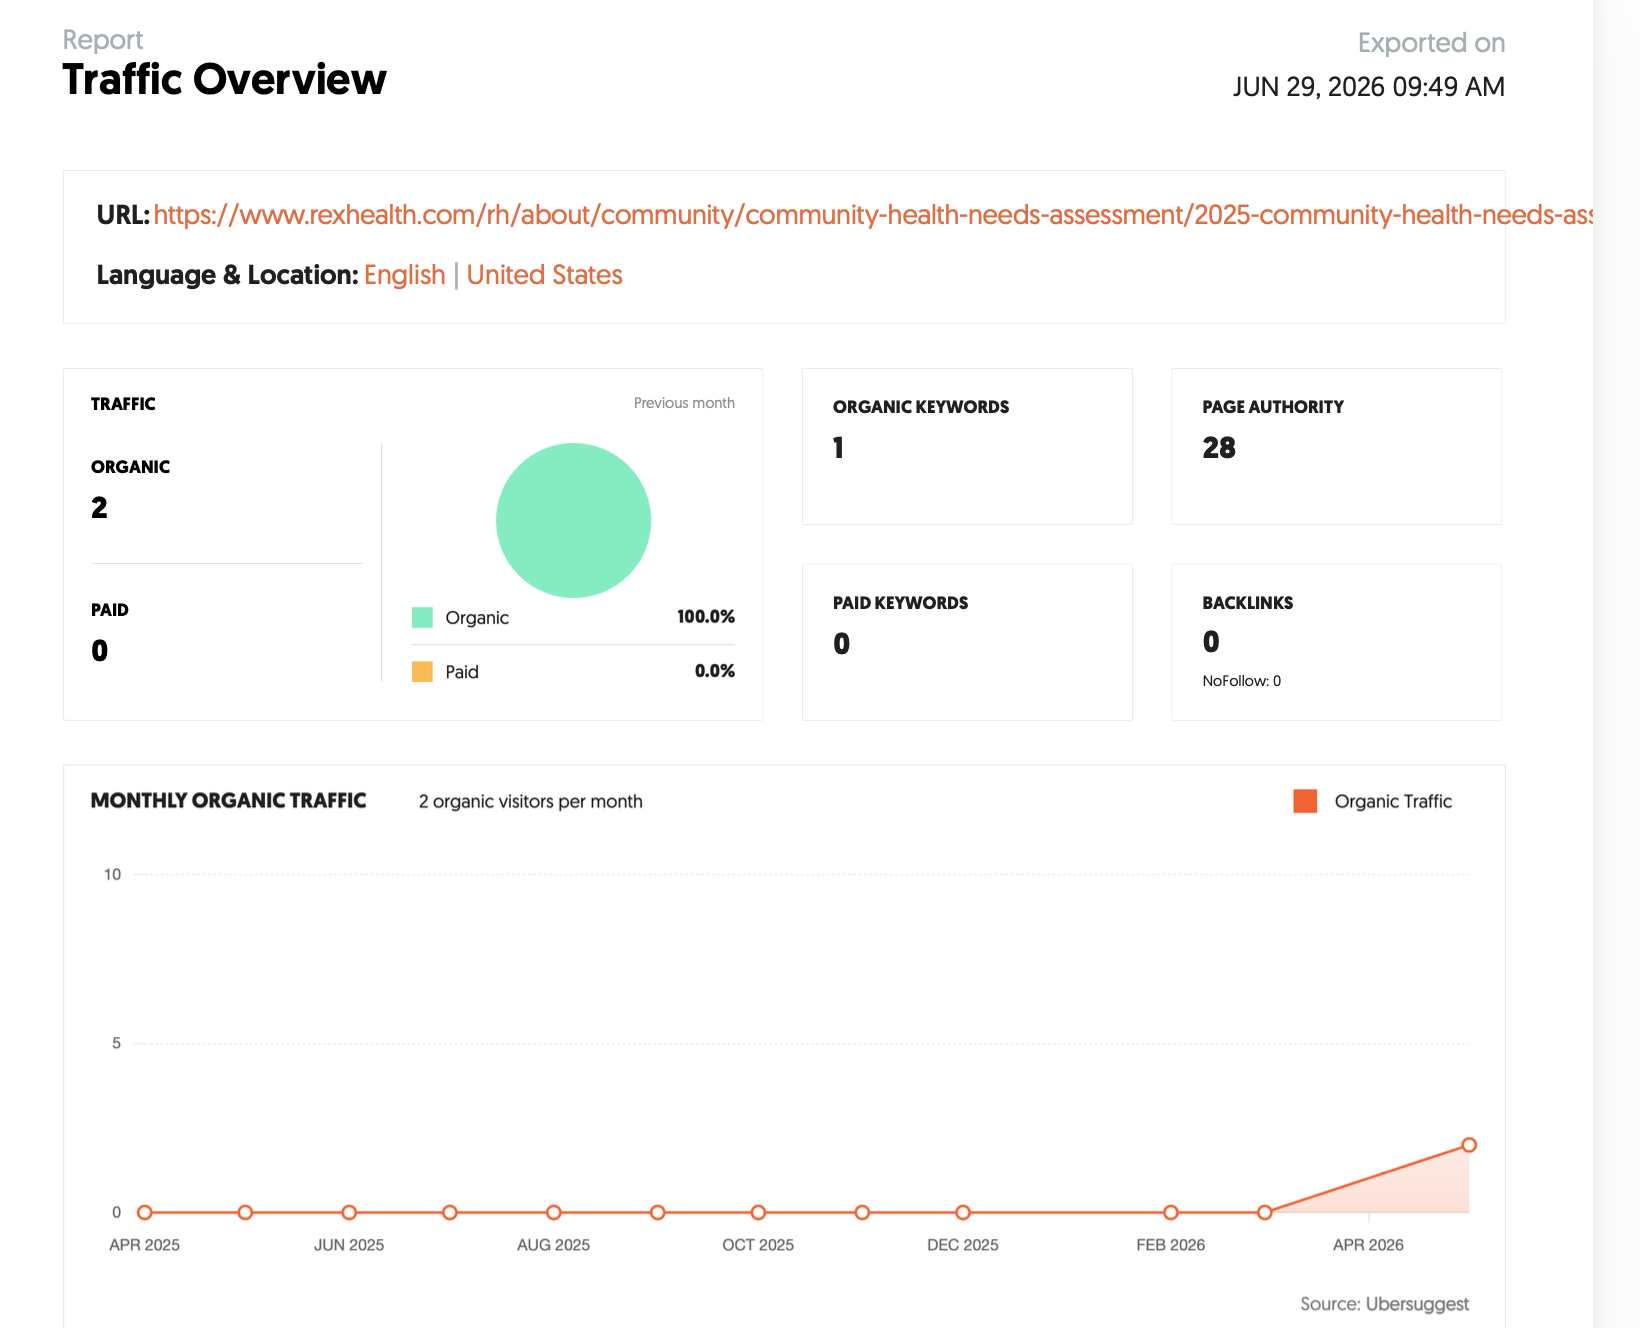
Here is the page from UNC Health Rex.
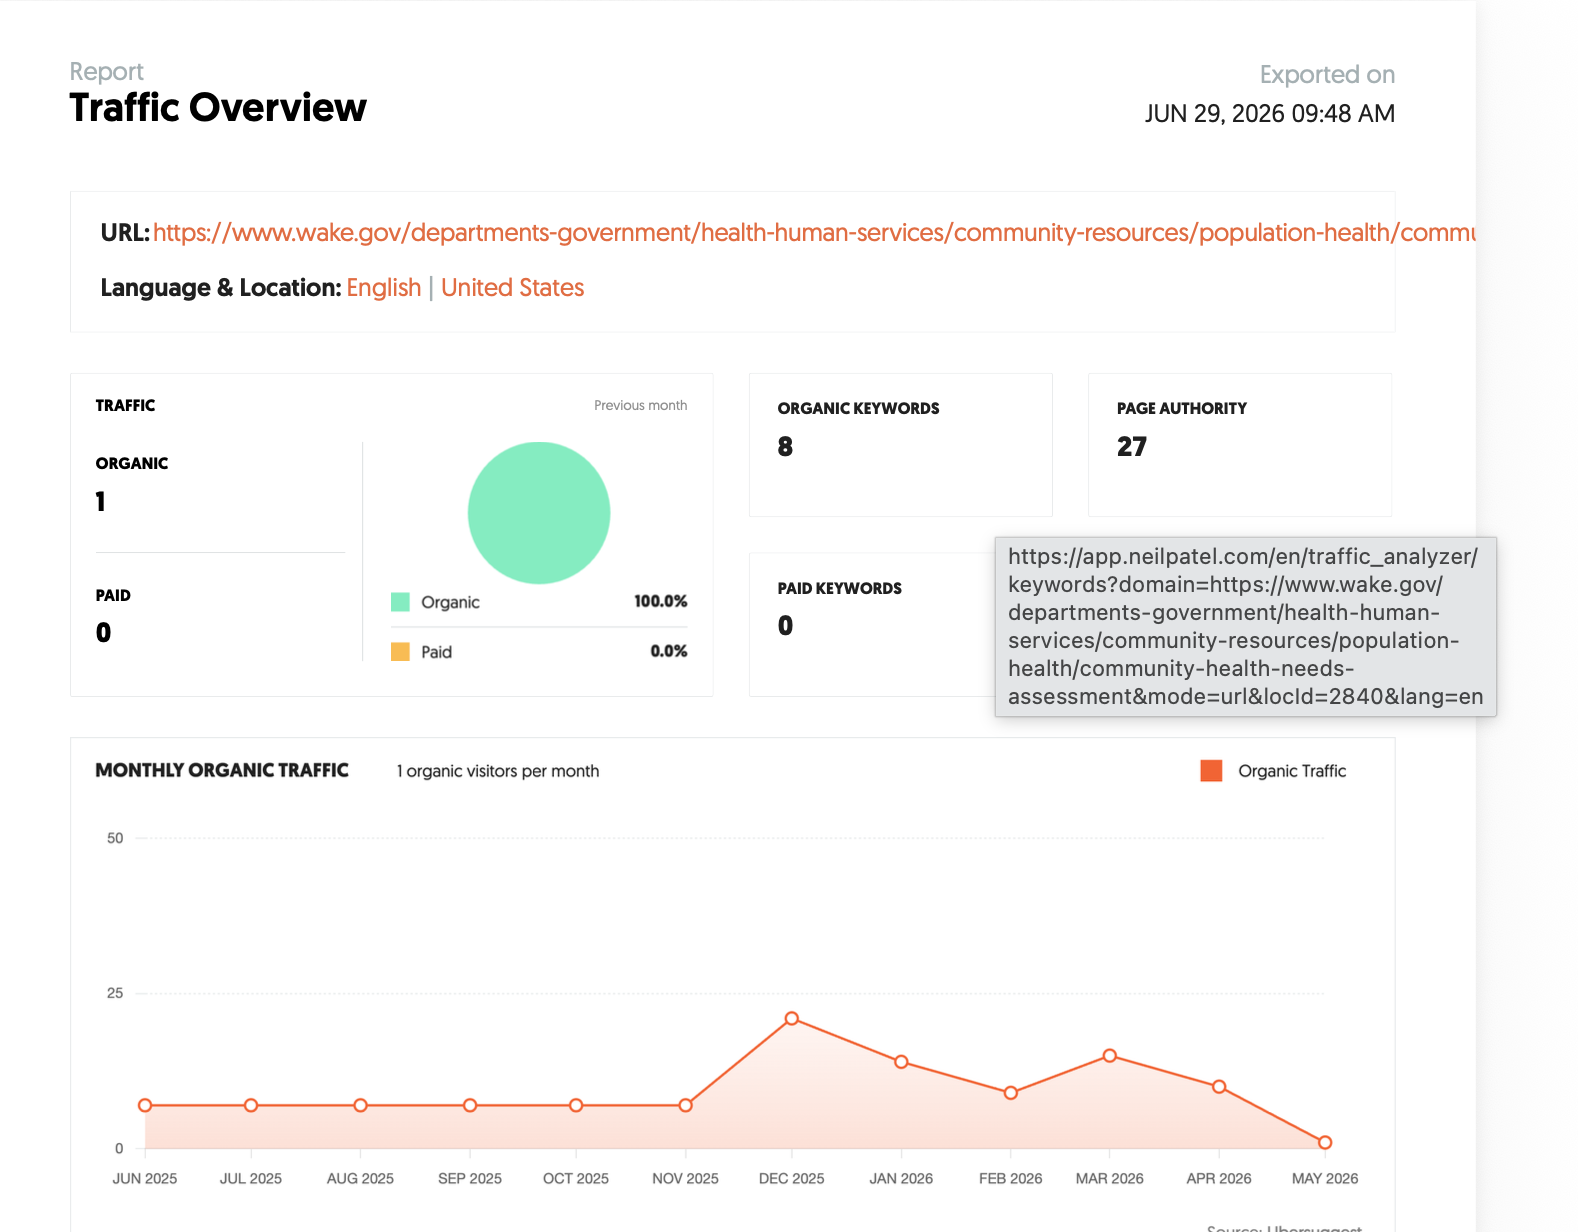
Here is the page where you technically should find it on the Wake County Government site. But for some reason nobody has found their way to posting the 2025 report, even though it was released a year ago. Of course, that page gets barely any traffic anyway.
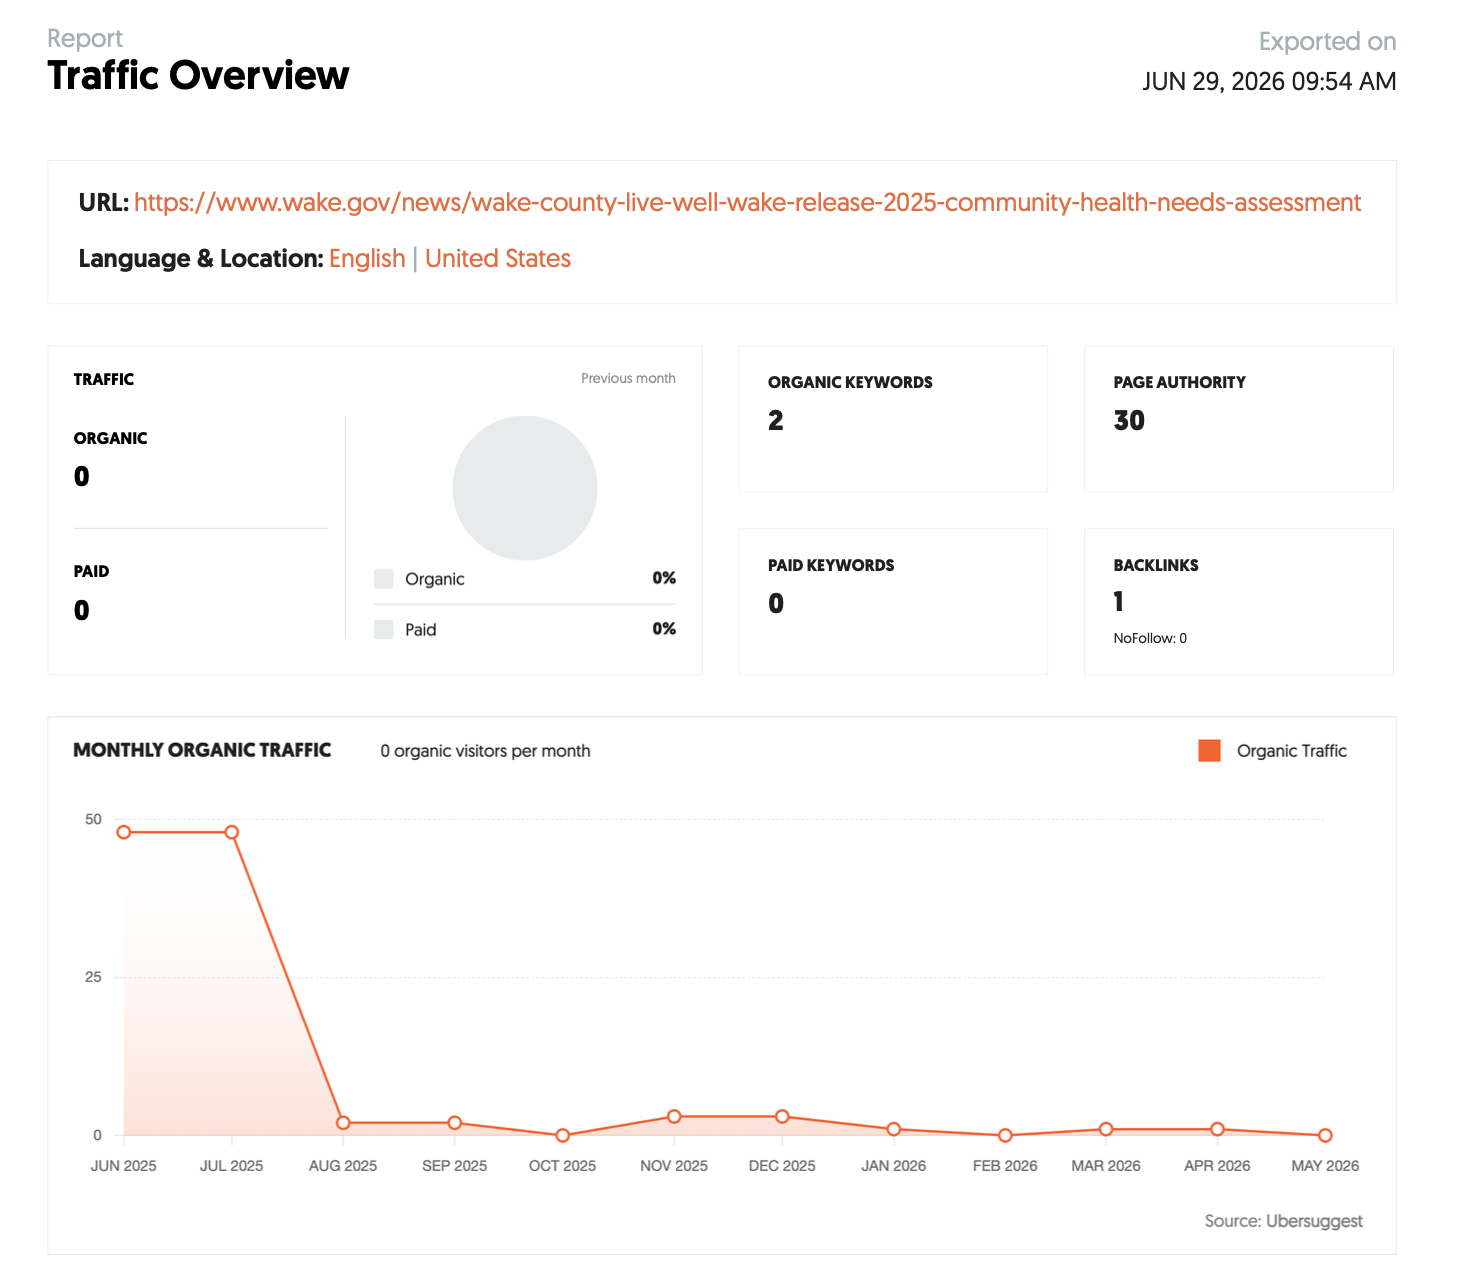
Wake County did put out a press release. Here are the traffic estimates for that.
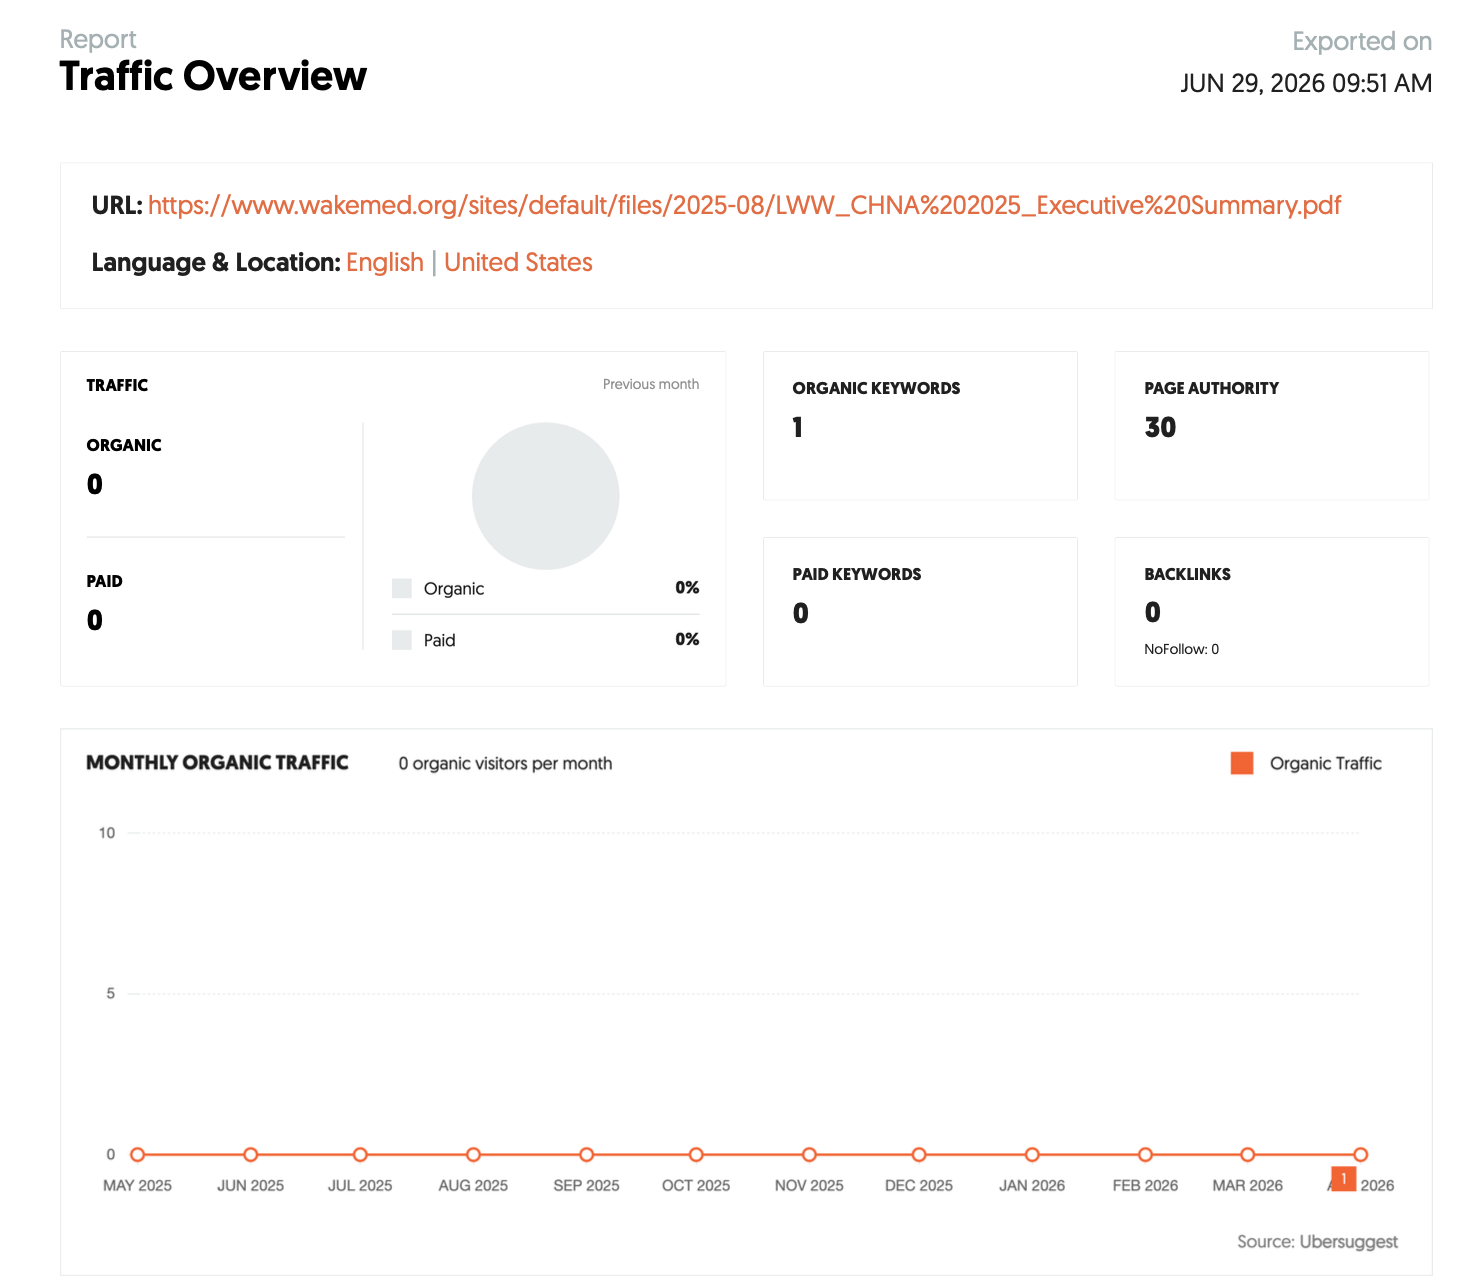
Here are the traffic estimates for the Executive Summary hosted on WakeMed.
How about on Social Media?
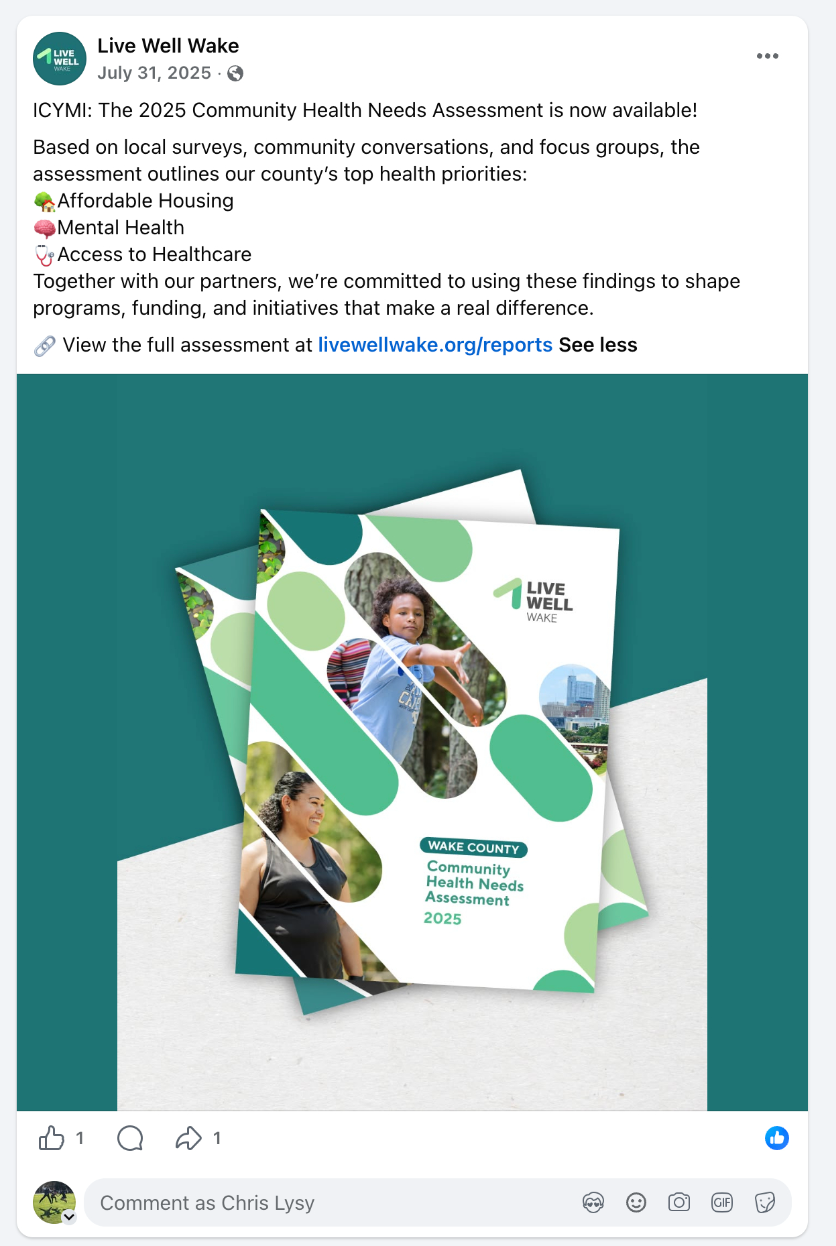
Here is a facebook post from Live Well Wake from last July. It got one Like and one Share.
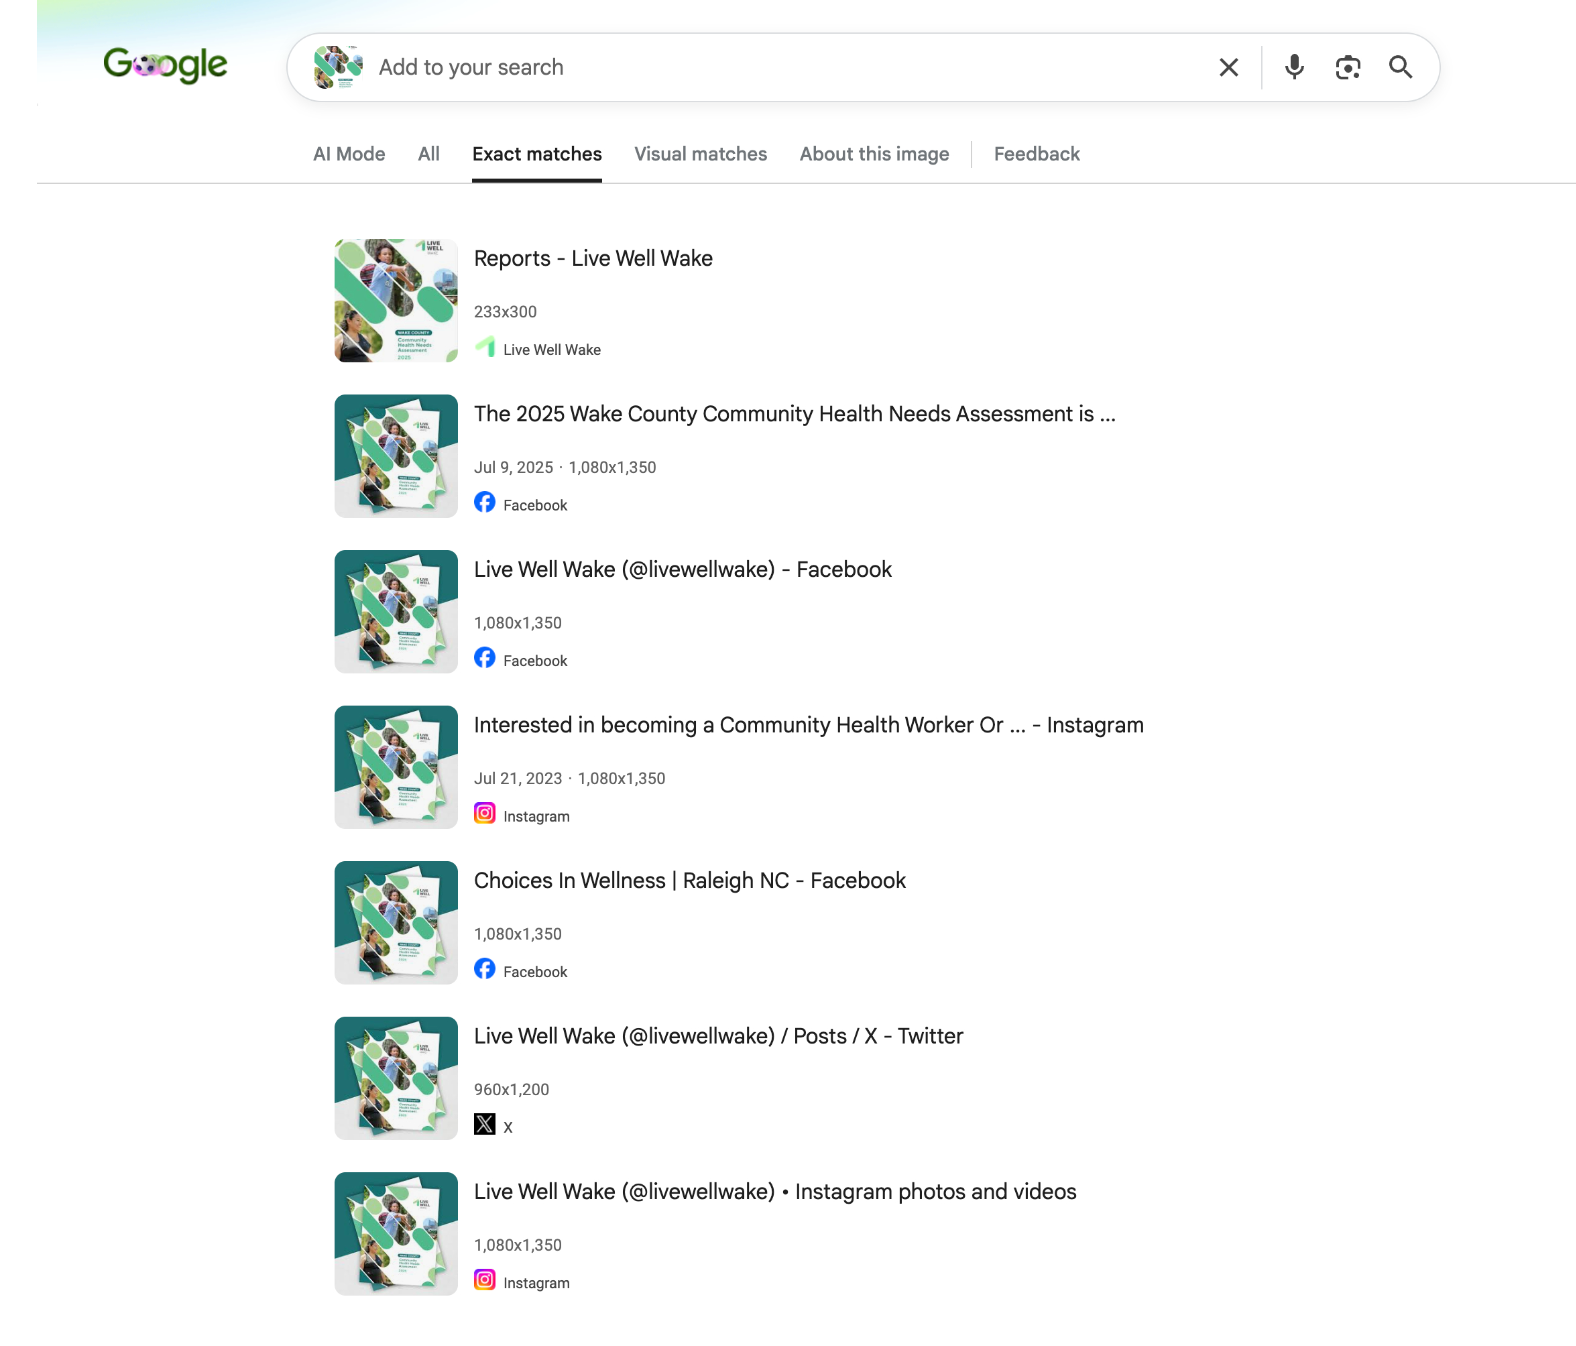
A reverse image search on the report cover also shows me very little sharing.
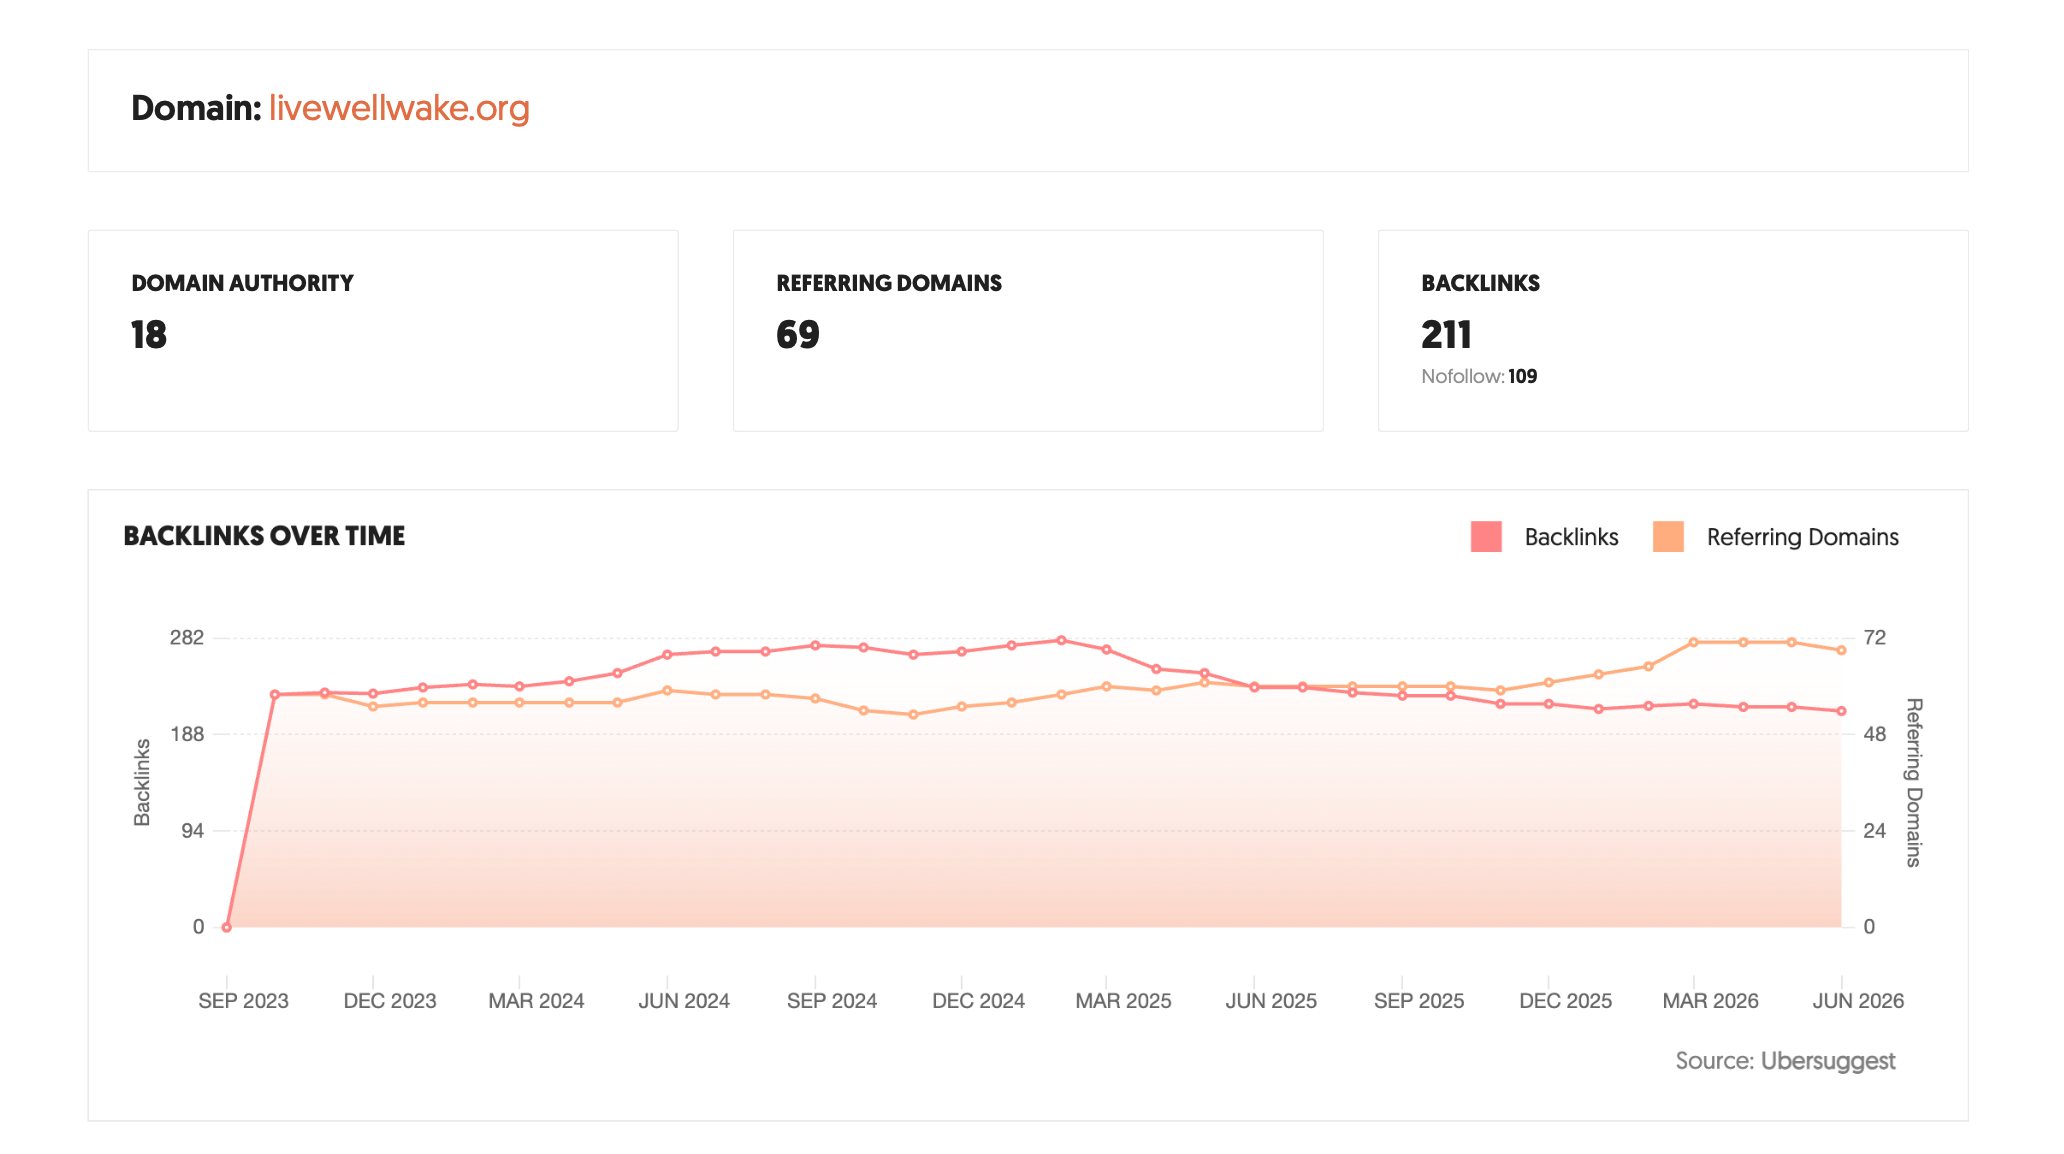
I also did backlink checks to see if anyone was talking about the report in ways not showing up in the search stats. And honestly, not really. If there were presentations or news stories, this iswhere it would show up.
The only stuff that did show up was related to the effort to share the survey and recruit study participants.
Lesson 1: This is a dusty shelf report and a compliance activity.
I did go through the whole report and assess the content, I’ll also talk about that shortly. But I don’t even need to look to know this.
Almost all of the effort put into this project was to create the report and graphically design it. Very little effort was put into sharing it.
The optimist me: Perhaps everyone involved in this report has the best interest of the community at heart. They just don’t have a dissemination budget and think posting the report is adequate.
The cynical me: If there was a comms budget it didn’t go into sharing. If it had, there would have been evidence. And that is fine with the higher ups involved. The goal for these reports isn’t really community health, it’s compliance. So posting is required, sharing is not.
Which one is right? Probably a little of both.
Part 2 – The Content Issue
So if you read part 1, you probably already know that I don’t think they put any real effort into sharing this report. But that doesn’t mean there isn’t interesting information here. In the 69 page report you will find stuff that people in the county might find useful.
Applying my theory of use framework I did a quick pull of ten insights.
Ten Theory of Use insights from the Wake County 2025 CHNA
| # | Type | Source | Insight | Audience |
|---|---|---|---|---|
| 1 | Surprising | CHOS survey | 60% of residents say they cannot find affordable housing in their community | Community, Public |
| 2 | Primary | Prioritization, Ch. 5 | The same three priorities — housing, healthcare access, mental health — topped both the 2022 and 2025 CHNA | Influencers, Client |
| 3 | Negative | CHOS, Ch. 4 | Over half of respondents rated Wake County as doing poorly on affordable housing, with lowest satisfaction among Black, lower-income, and less-educated residents | Community, Influencers |
| 4 | Contextual | Community Conversations | Language barriers prevent non-English speakers from filling out insurance forms, understanding costs, and communicating with providers | Community, Influencers |
| 5 | Surprising | Secondary data, Ch. 4 | Wake County has fewer licensed mental health and addiction providers than Mecklenburg County despite faster population growth | Influencers, Peers |
| 6 | Secondary | CHOS, Ch. 4 | Roughly 1 in 4 residents who needed mental health care did not seek it — primarily due to lack of insurance and appointment availability, not stigma | Community, Public |
| 7 | Negative | Secondary data, Ch. 4 | First-trimester prenatal care (71.1%) is below the HNC 2030 goal of 80%, partly due to Medicaid processing delays | Influencers, Client |
| 8 | Contextual | Tables 4 & 5, Ch. 5 | The prioritization survey was 73% women and underrepresented Hispanic/Latino respondents (5.8% vs. 11.5% of county population) | Peers, Influencers |
| 9 | Surprising | Secondary data, Ch. 4 | Black infant mortality in Wake County is 10.6 per 1,000 live births — 3.5x the rate for White infants (3.0) | Community, Public |
| 10 | Secondary | Community Conversations | Residents described crisis services as short-term fixes that don’t address chronic needs, particularly for people experiencing homelessness and veterans | Community, Influencers, Public |
There is a lot more I could pull from the report. But without any actual dissemination sharing efforts, very little of it will go anywhere.
The Report’s Framing and Reading Between the Lines
I think the report was framed in a way that really paints Wake County in a positive light, and its presence at the top of the health rankings as a great success. You can see this in the opening paragraph…
“Wake County was ranked as the healthiest North Carolina county for Population Health and Wellbeing
in the 2025 County Health Rankings & Roadmaps Program and is consistently ranked as one of the best
places to live, work, play and learn in the US. This success is largely due to the collaborative efforts of
various partners, including those involved in the development of this Community Health Needs
Assessment and the residents of Wake County”
Here are my problems with that framing.
1. They don’t compare 2025 numbers against past reports.
CHNA reports are completed every three years. The Wake website shows 6 past reports. But the 2025 report rarely talks about anything in the past reports.
2. They don’t follow-up on their community health improvement plan.
After the 2022 report they created a community health improvement plan. You could imagine they would want to systematically review the success of that plan. While there were mentions of the plan, there was not really any kind of straightforward review. The same healthcare priorities have existed for at least the last 3 reports, but there is no tracking of progress.
3. They only compare themselves against Mecklenburg county and the state.
You can easily argue that Mecklenburg is the closest county to Wake demographically in the state. But there are quite a few differences. While they have similar populations, Wake is richer with a lower poverty rate and has a different racial composition. All of these things contribute to different health outcomes.
So the we’re better than Mecklenburg in health outcomes doesn’t mean they are necessarily doing better than Mecklenburg in terms of health improvement.
| Wake County | Mecklenburg County | |
|---|---|---|
| Population | ~1.18 million | ~1.15 million |
| Median household income (2024) | $105,768 | $87,005 |
| Poverty rate | 8.1% | 10.36% |
| Largest city | Raleigh | Charlotte |
| Racial composition | ~57% White, ~19% Black, ~9% Asian | 43.2% White, 29.7% Black, 16% Hispanic nih |
4. They don’t address the affordability data, rise of homelessness, and equity stats.
The county is growing fast and there isn’t enough affordable housing. Homelessness is on the rise and there are lots of healthy equity issues that are still easy to see in the data.
My Alternate Hypothesis.
As I was thinking about this report I couldn’t get this idea out my head. And with public data from the Census I should be able to look into it.
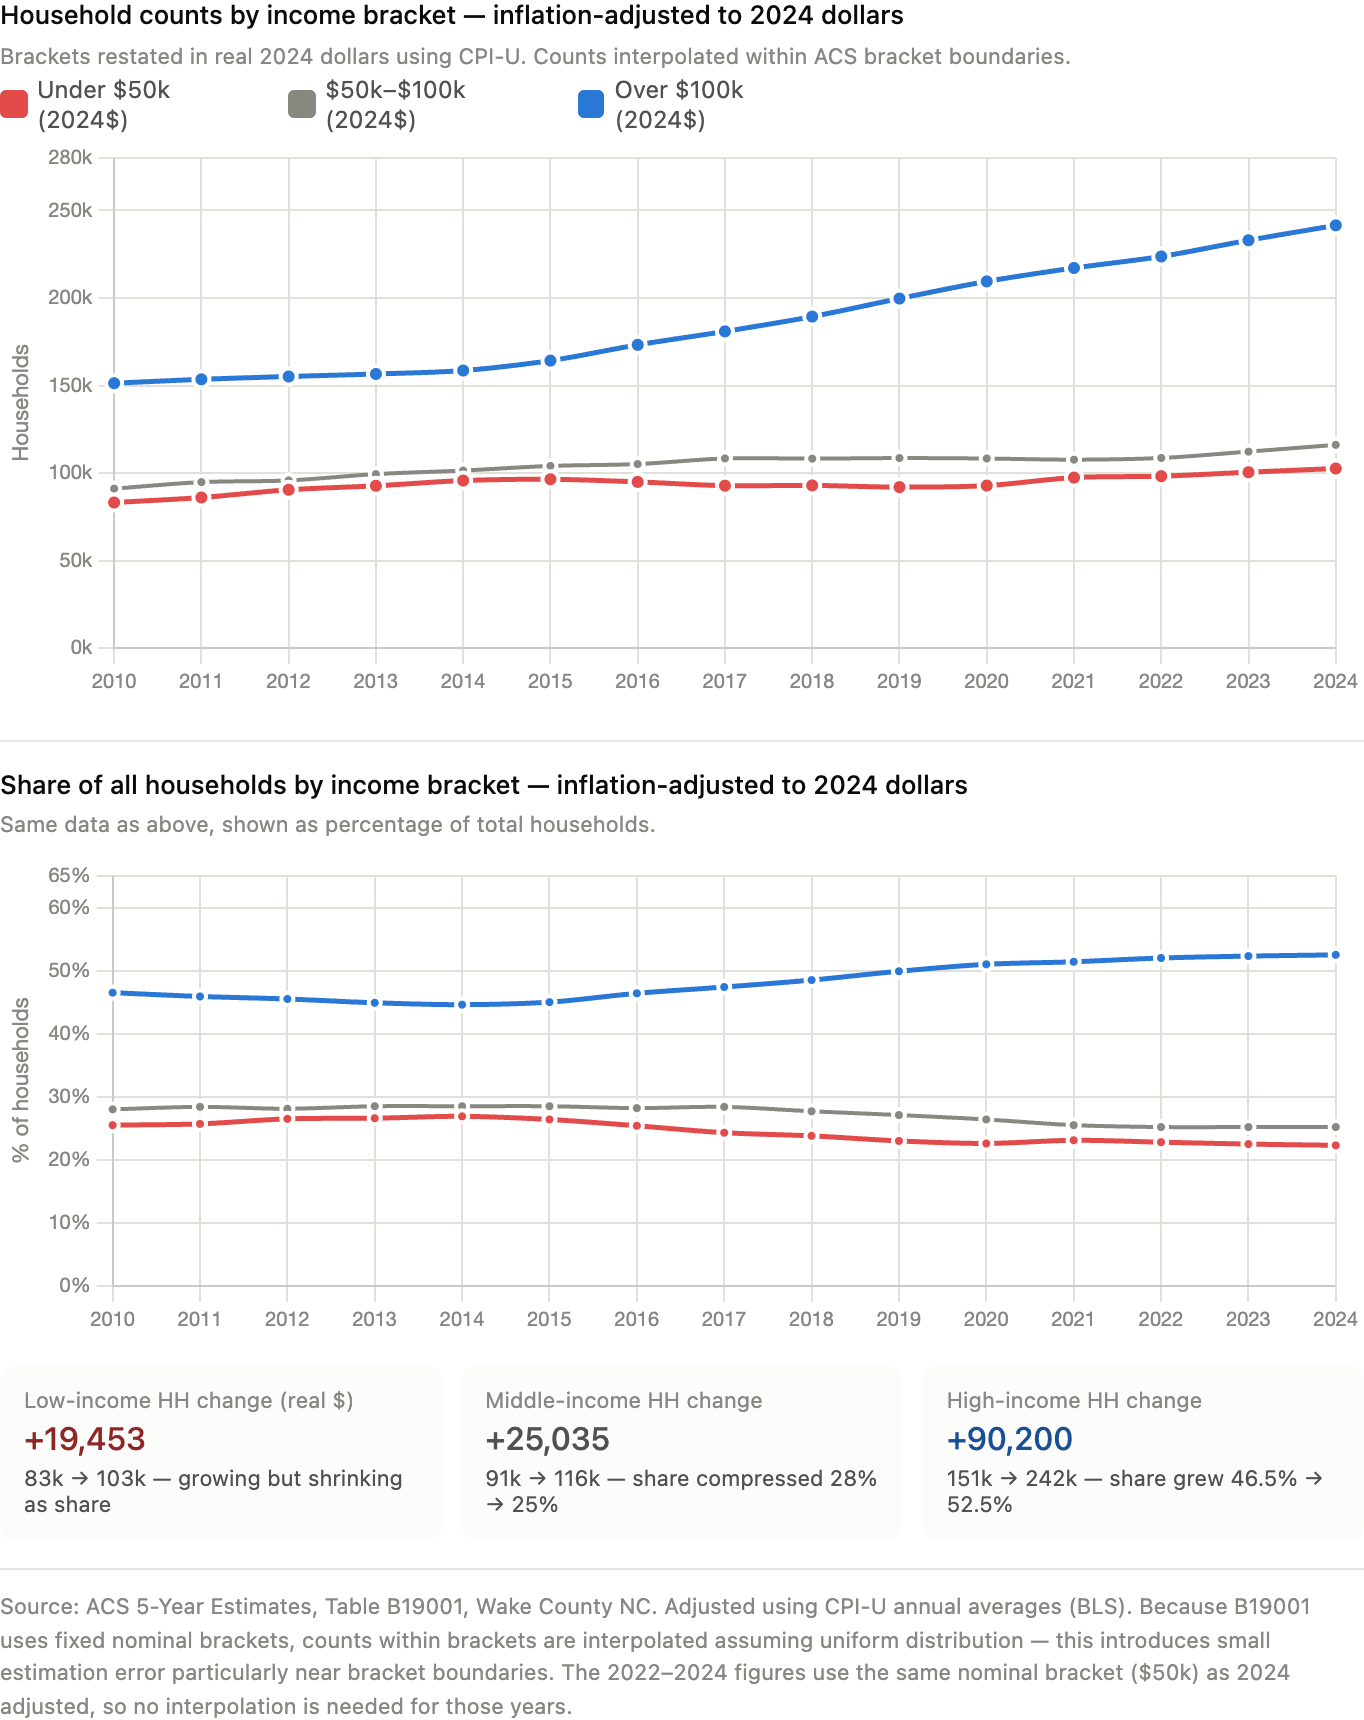
Wake County might be the Healthiest, but it’s also the Wealthiest. Can the improved health stats be partially explained by changing demographics (a higher percentage of wealthy households)?
Who is moving into Wake? Is it actually pulling in wealthier households?
The answer to this question is a definite yes. While households across all income groups are growing, the over 100K households are growing much faster.
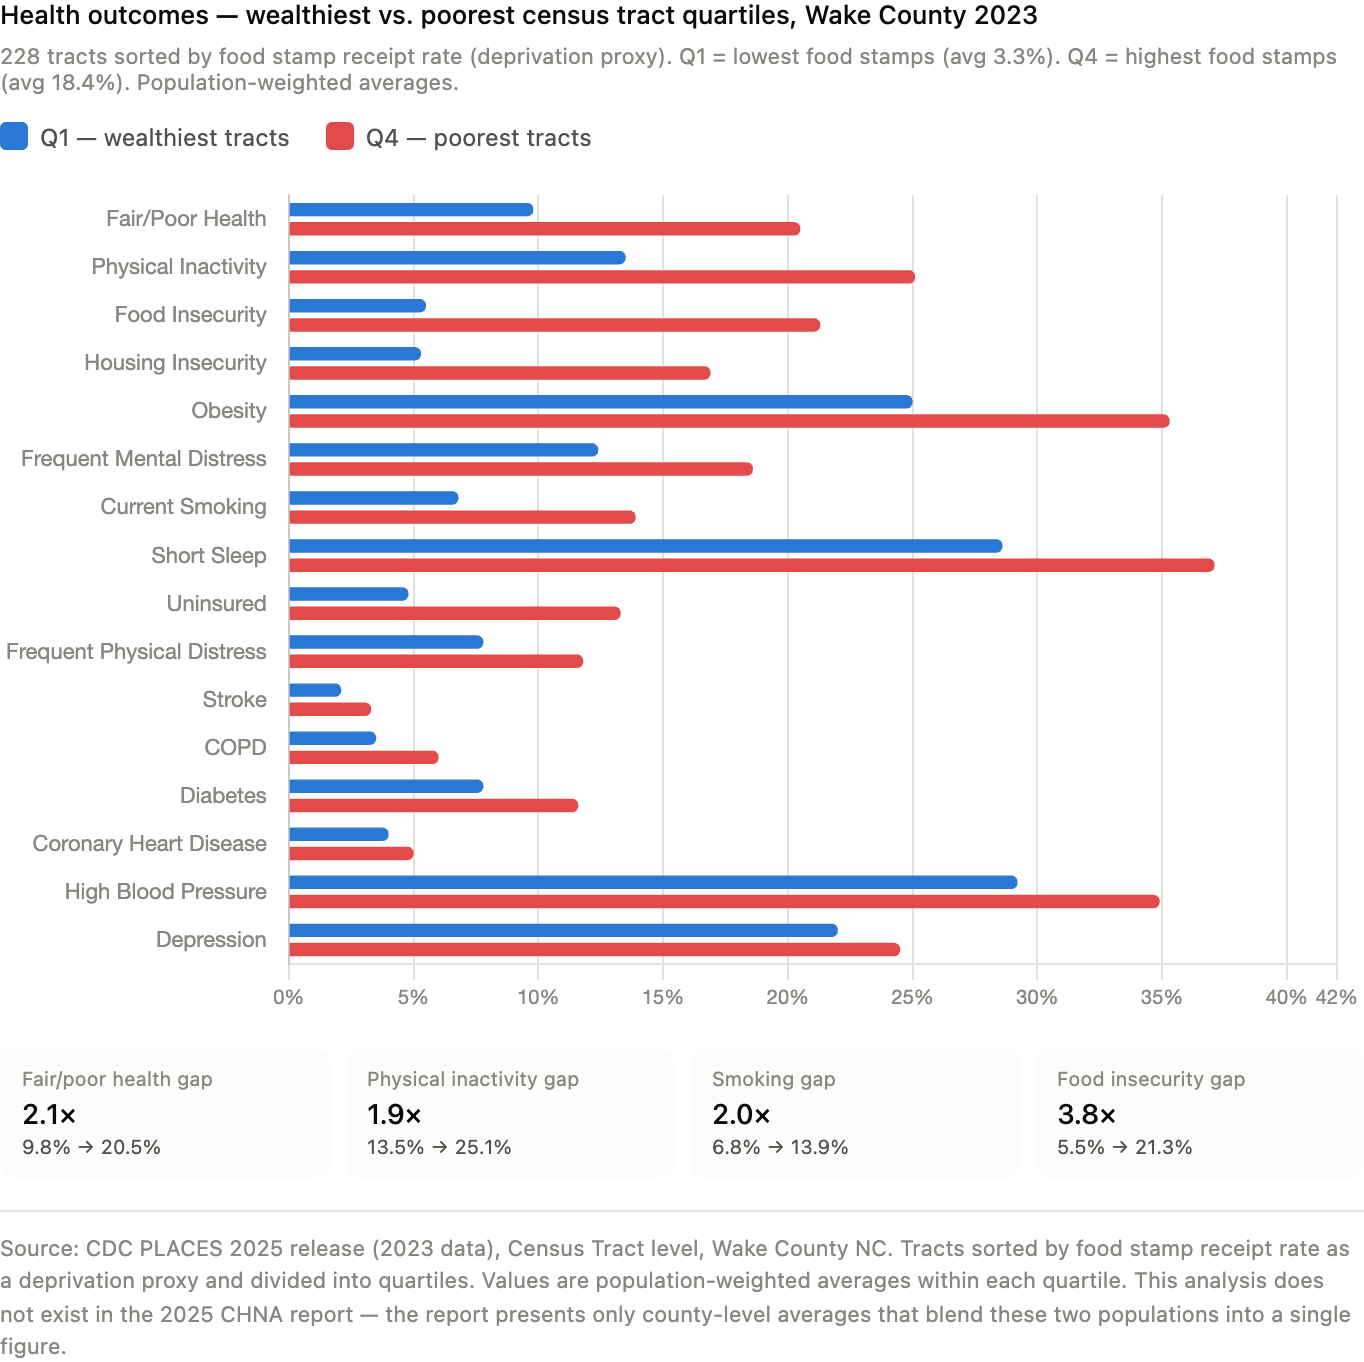
Are the wealthiest in Wake county showing better health outcomes?
The answer to this question is also a definite yes. Health outcomes all around are far worse for people living in poorer census tracts. Especially when it comes to food and housing insecurity.
Lesson 2: Good stories are often hidden in plain sight.
I didn’t start this report review with any idea that I would be ending this post with a working paper critiquing the findings in this report. But now that we have the tools at our disposal, why not?
If you’re interested you can read my full working paper by clicking on the following link.
awesome job Chris in the critical thinking and what seems like could/should be obvious is made obscure through the reporting. and so many missed opportunities for insights. good for you for shining that light with the alternate hypothesis!! always enjoy reading and learning from you.
Thank you Aimee 🙂
Always appreciate your thinking, Chris, and these are great insights to help us make our own CHNA reporting better next time.
Thank you Jen 🙂