Summary: In this post I’m going to tell you the future.
You can think about prediction as looking at the past and then projecting into the future. But there is an easier way. Instead of looking backwards or forwards, look to the side.
Whatever you face, chances are, other fields or organizations are going through similar changes brought on by similar challenges. And there are some things we can predict by just paying attention to what’s happening elsewhere.
I believe the future of reporting is one of those things.
The future is already here — it’s just not very evenly distributed.
William Gibson
Following the News.
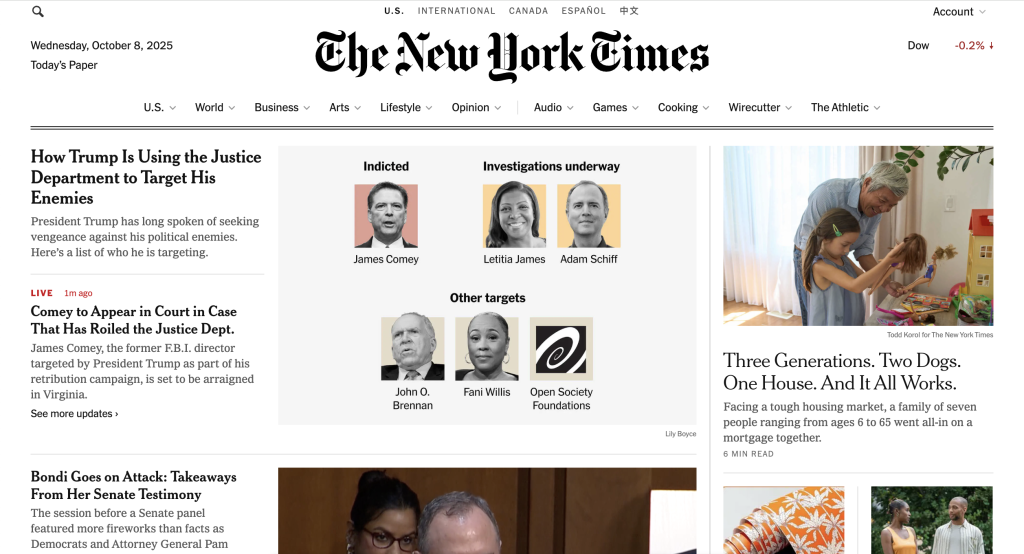
The NY Times didn’t launch its website until 1996. At that time its business model was built on a foundation of advertising revenue. It carried that foundation to the web.
And there it stayed, eventually losing revenue consistently until changing their business model in 2011. That was when they introduced their paywall and started building their digital subscriber base. But it took until 2020 for digital subscription revenue to overtake the print side.
Now, 5 years later, it’s even more extreme. 95% of the NY Times subscribers are digital. And the newspaper turned multi-media company now generates far more revenue from digital subscriptions than any other source.
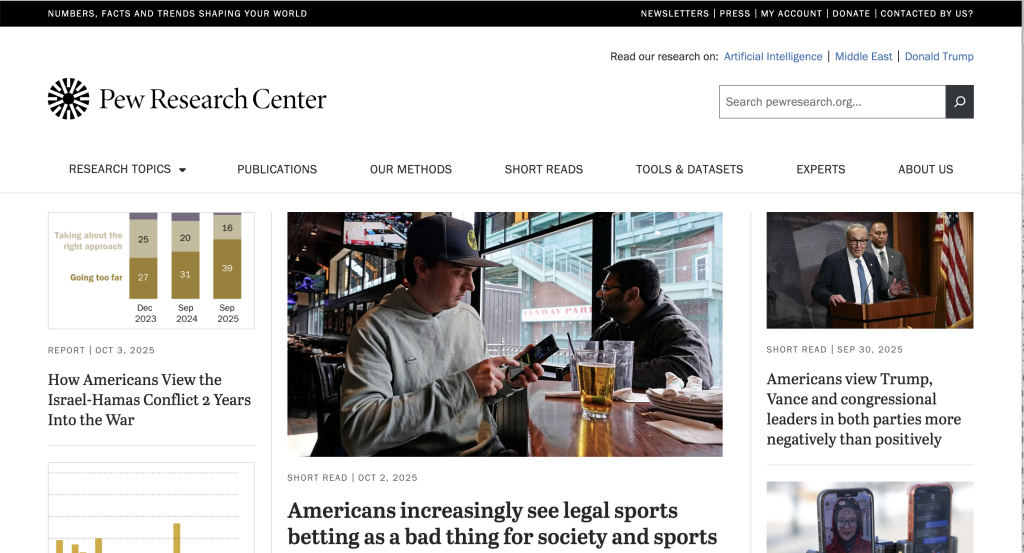
Pew Research, Look Familiar?
In the early 2000s, the website for Pew Research felt similar to the websites of other research organizations. It was built around a resource library. It was more detailed than your usual PDF research library, with summary pages instead of single paragraph long abstracts. But it still relied on a PDF download if you wanted the whole report.
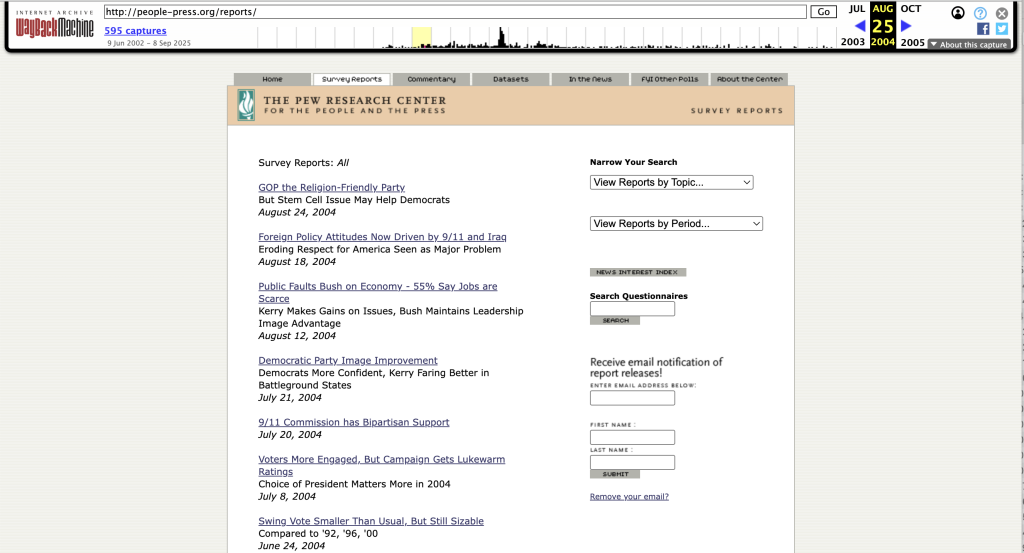
Nowadays the website for the Pew Research Center feels more like a news or magazine site. It’s built around a continuous stream of articles. And while you can still find PDFs to download with the bigger reports, they are not essential. You can read everything from the opening page to the methodology section via the website, without downloading anything.
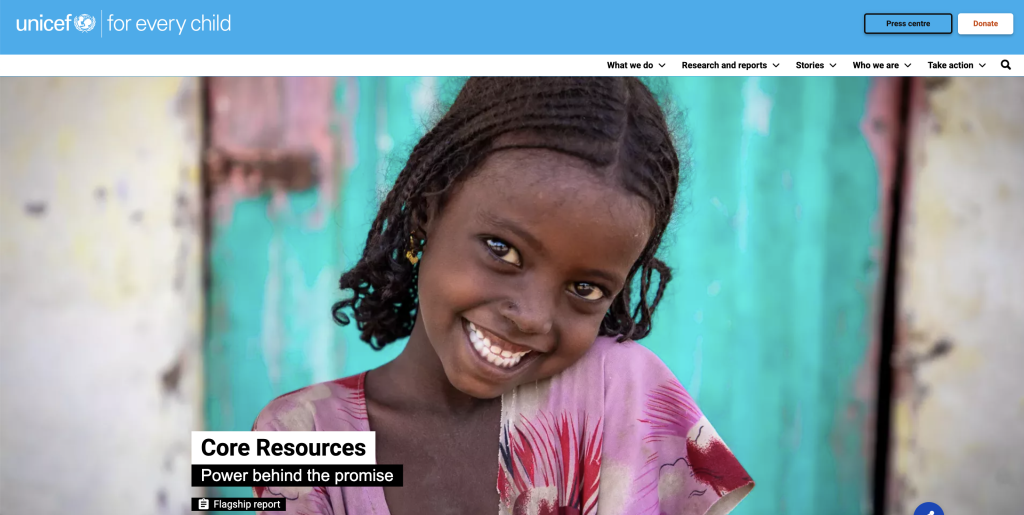
A Single UNICEF report.
The NY Times didn’t just move from paper to digital. It went from just sharing articles to include videos, games, a podcast network, interactive visualizations, infographics, and more.
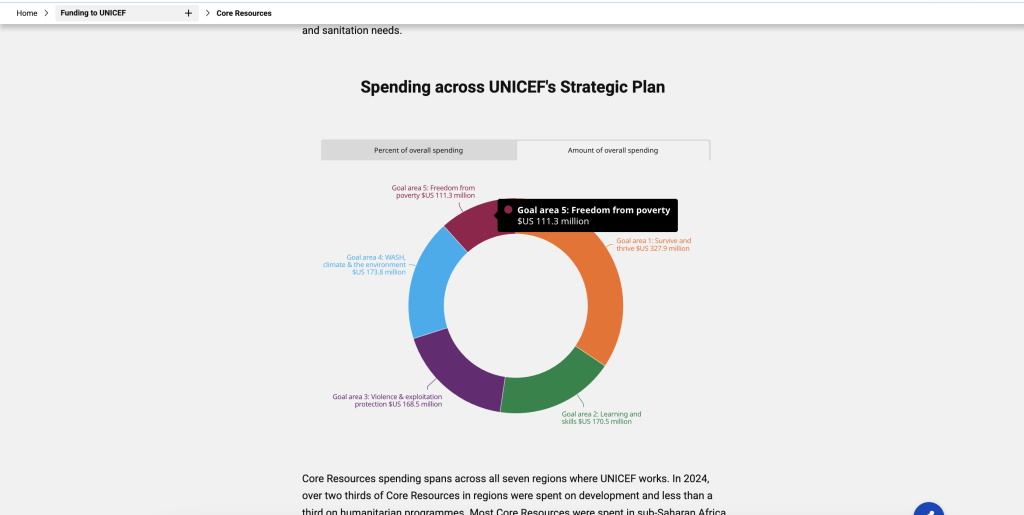
UNICEF calls their biggest reports “Flagship reports.” And we can now see that same kind of multi-media change in a single UNICEF report.
There are lots of pictures.
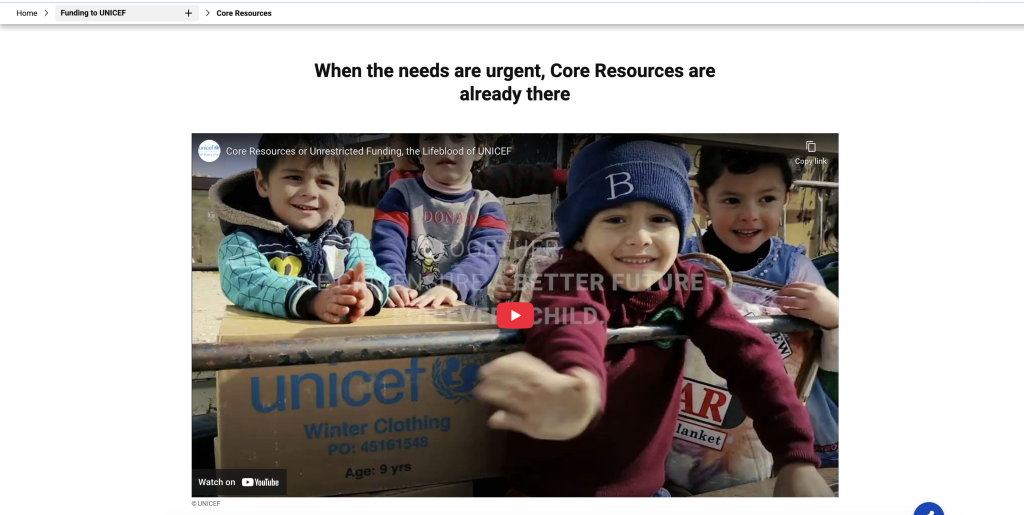
There are videos.
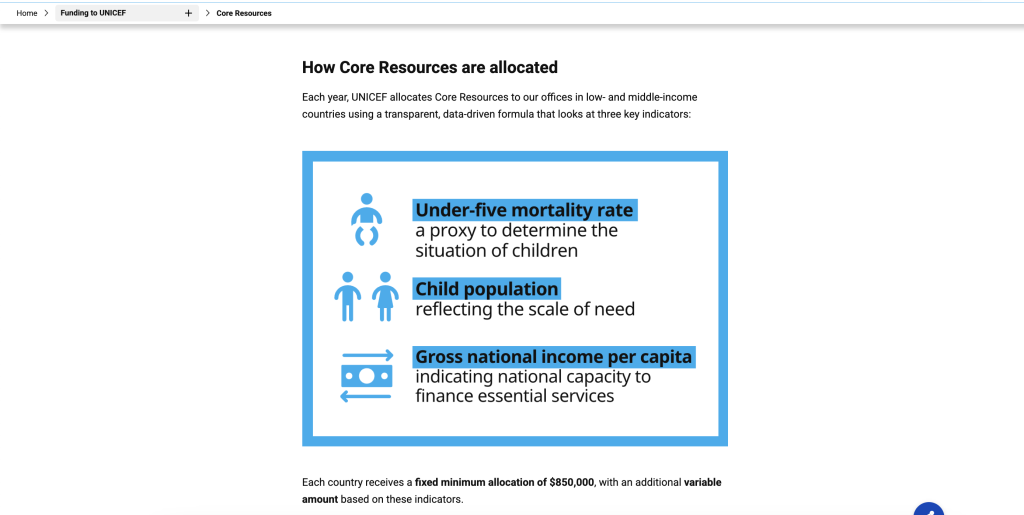
There are infographics.
There are interactive visualizations.
So reports have not only changed from being PDF-First to Digital, they have also become something you can’t easily replicate in a printed format. Reports are now experiences.
The Reporting Evolution.
The more I’ve looked into this and considered my own experiences creating reports and teaching report design to others, I’ve started to see some patterns in how an organization’s reporting evolves.
Can you find yourself in these phases?
Phase 1 – PDF-First
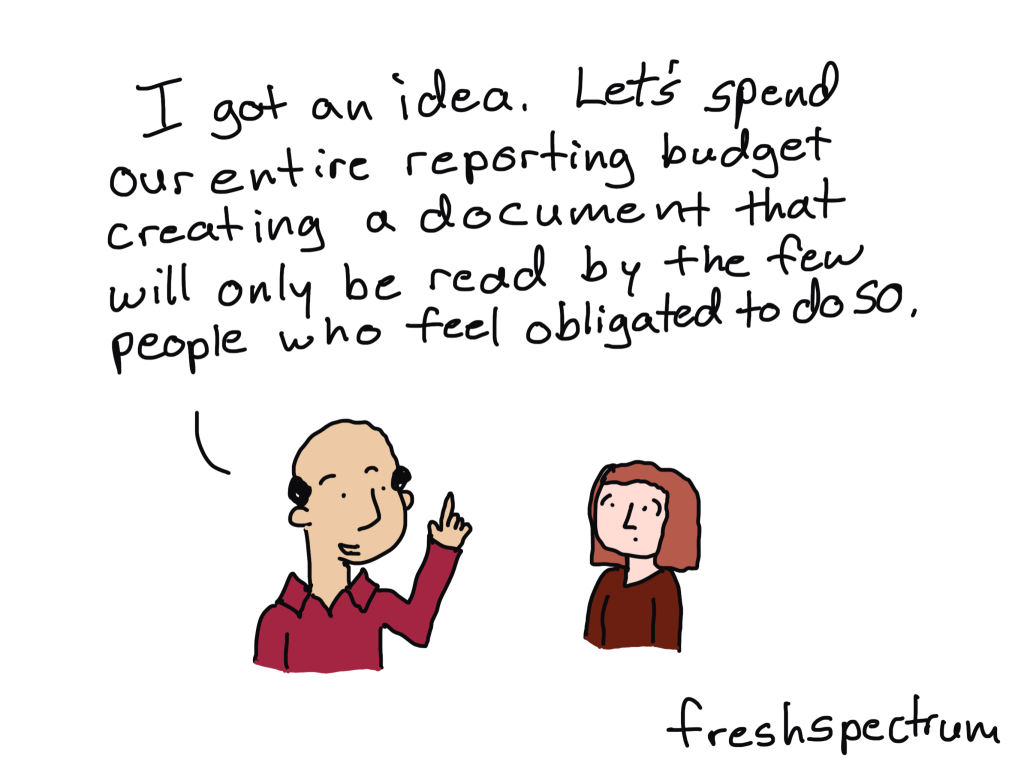
This is still a LOT of organizations. The report is a product you release once a year or once every two years (or some other term). It’s a PDF download. Depending on your organization, it might be a well designed PDF with lots of visuals. You might have a nice abstract page on the website, but to get the full report you need to download.
PDF reporting is the status quo, but it’s also very ineffective. There are no feedback loops, PDFs don’t fare well in terms of SEO, and people don’t always like downloading things.
Phase 2 – Organic Experiments
Phase 2 is what happens when some of your employees are creative sorts who decide to do a bit of experimenting. They might be trying out new tools or applying lessons learned from their latest workshop training. These experiments with infographics, newsletters, podcasts, videos, and dashboards might be encouraged but they are generally not funded initiatives.
The goal for the report is still a PDF download, you just might have a few additional fun products to share along side. There is also an additional challenge here. If you have creative employees doing innovative work, but you’re not giving them full management support, or budgets, you will likely lose these employees sooner than later.
Phase 3 – Pilot Experiments
The difference between phase 2 and 3 is that leadership is now involved. You’re now officially testing different reporting strategies with actual budgets attached. Not all of these experiments will be successful and sometimes you might blame a good tool for a bad implementation. But if successful, you might get to move on to phase 4.
Phase 4 – Parallel Production
I get the sense that some organizations might stay in phase 4 for a long time. Basically, you find a digital-first strategy that works. But you also do all the same stuff to produce the PDF you’ve always produced. The two reporting strategies live in tandem. Just look at the NY Times example from before. The print side and the web side spent years being two entirely different things and teams.
Some people see this as the best of both worlds, but it’s also expensive and can be frustrating. You’re doing more work, which takes more time, which costs more money. And if your team doesn’t get more budget, it can get overwhelming quickly.
Phase 5 – Continuous Multi-media Reporting
This is my favorite phase. It treats evaluation as a process, not a product, and you can actually build a report audience. There are feedback loops when sharing new pieces of information. And you can easily reach way more people.
You can even start really simple. Just create an evaluation reporting newsletter. Invite all the people you want to be in your audience to join your reporting email list. When you have information to share, share it. Don’t wait until the end of the evaluation, start by describing methods or talking about the program design.
Build out a reporting content calendar and start sharing with a regular cadence. Almost all email newsletters get very low click rates, but can easily get 40%+ open rates. So share as much as you can without requiring clicks.
The Future of Reporting [in short]
- Reporting transforms from a product (usually a PDF download) to a process (continuous reporting).
- Modern reports feel more like newspapers and magazine websites than they do reports.
- Multi-media (lots of variety)
- Includes audience building and feedback loops
- Mobile-responsive.
Serious about transforming your organization’s reporting process?
Prove it.
Let’s chat about where you are and your plan for next steps.