
I created this video for one of my workshop modules. I always liked the soup metaphor when talking about the differences between summative and formative evaluation. With this video I tried to take it one step further.

Creating an Interactive Infographic
So my latest diydatadesign module focuses on creating an interactive infographic using a free easy-to-use web tool called Adobe Spark. For the example I decided to create an evaluation related infographic featuring 5 of my favorite evaluation cartoons. I thought you might appreciate it so I’ve shared it below. Interested in learning how to do it […]

Why simply defining evaluation is not enough.
So I’ve only been independent for half a year but I’ve certainly learned one thing. If you have to spend a lot of time defining or explaining something, it’s going to be a hard sell. Which brings me to evaluation… Some of my most popular cartoons fit under the what is evaluation theme. The fact […]

An Evaluation Christmas Carol
Evan Scott’s day started just like most other days. At his desk, staring at a clogged email inbox and a stack of papers filled with things that somehow or another needed his attention. If he had known just how much paperwork was involved he might have ignored his desires to devote a career towards helping […]

The “wow it’s already December,” holiday cartoon post
Somehow, I don’t believe I had a holiday cartoon post last year (3 of these cartoons were actually created a year ago). A couple of things before we get into the cartoons. I will have a coupon up for the rest of this week allowing you to try my full diydatadesign workshop for a full […]

The “what is wrong with my report” cartoon post.
Here is a set of cartoons inspired by one of my latest free courses over at diydatadesign (I think the report color scheme one is my favorite). As an FYI, I just made diydatadesign simpler by combining all the self-paced video lessons and activities into one single course. I also split the live coaching sessions […]
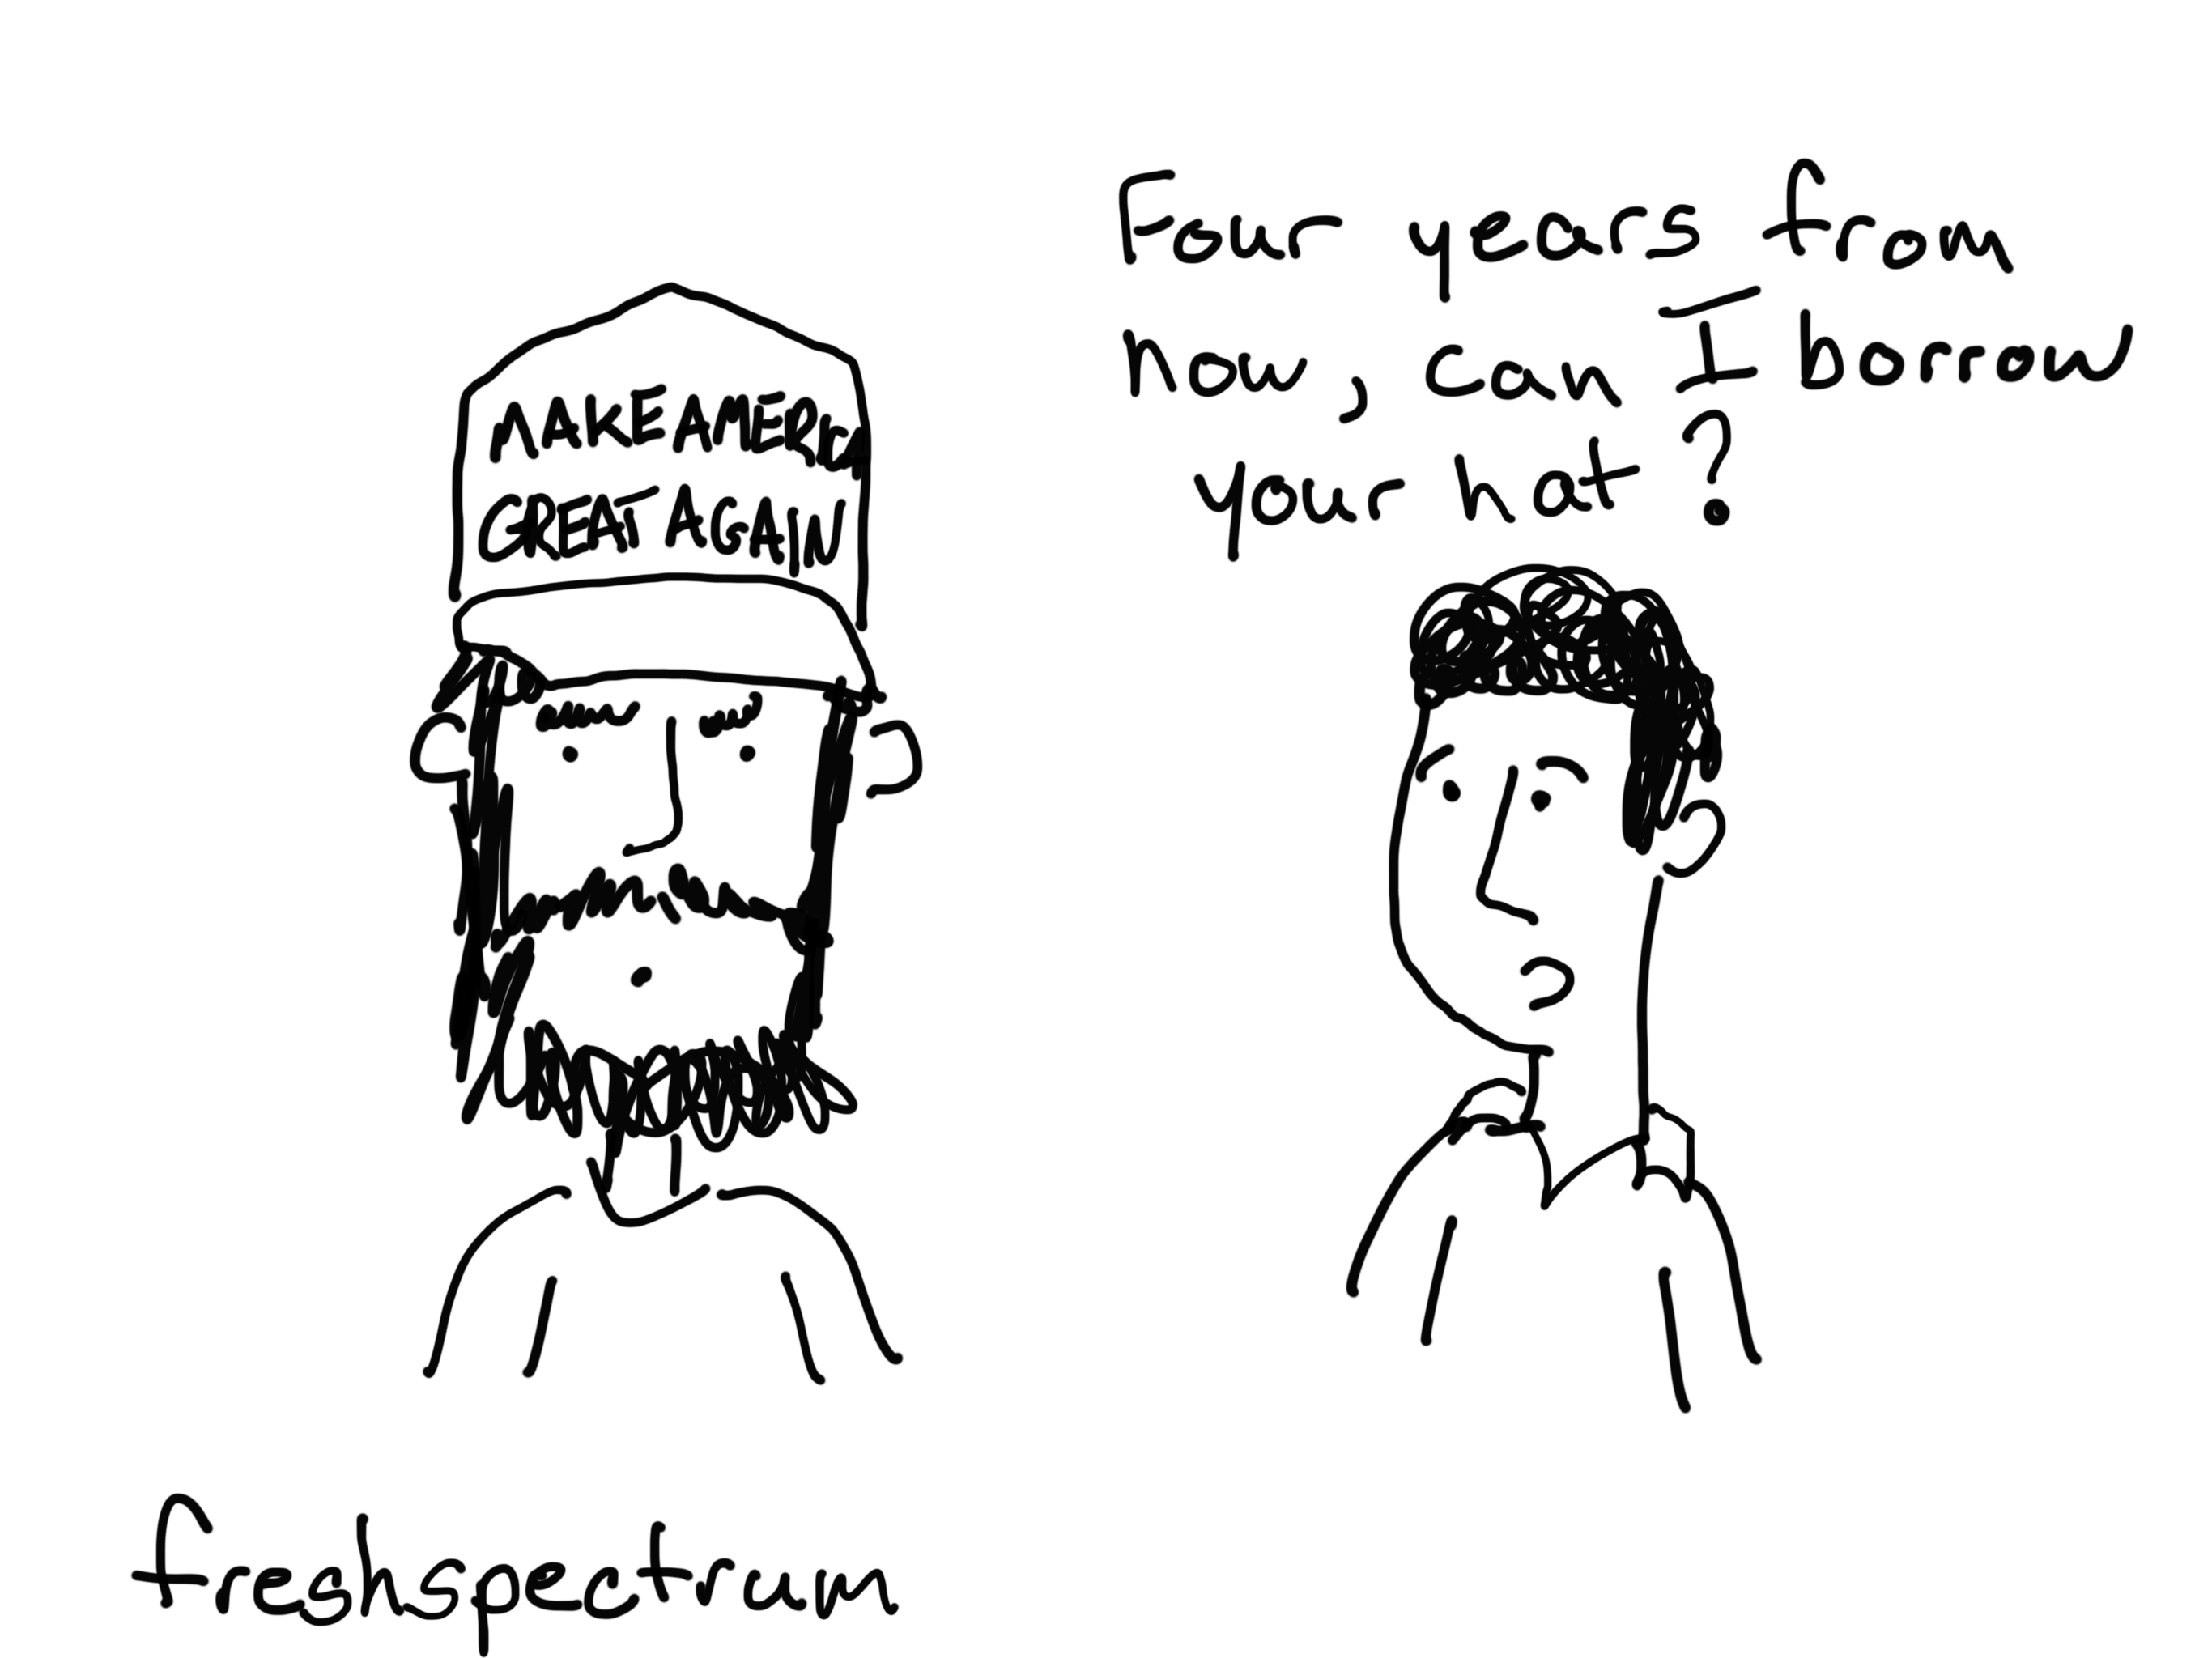
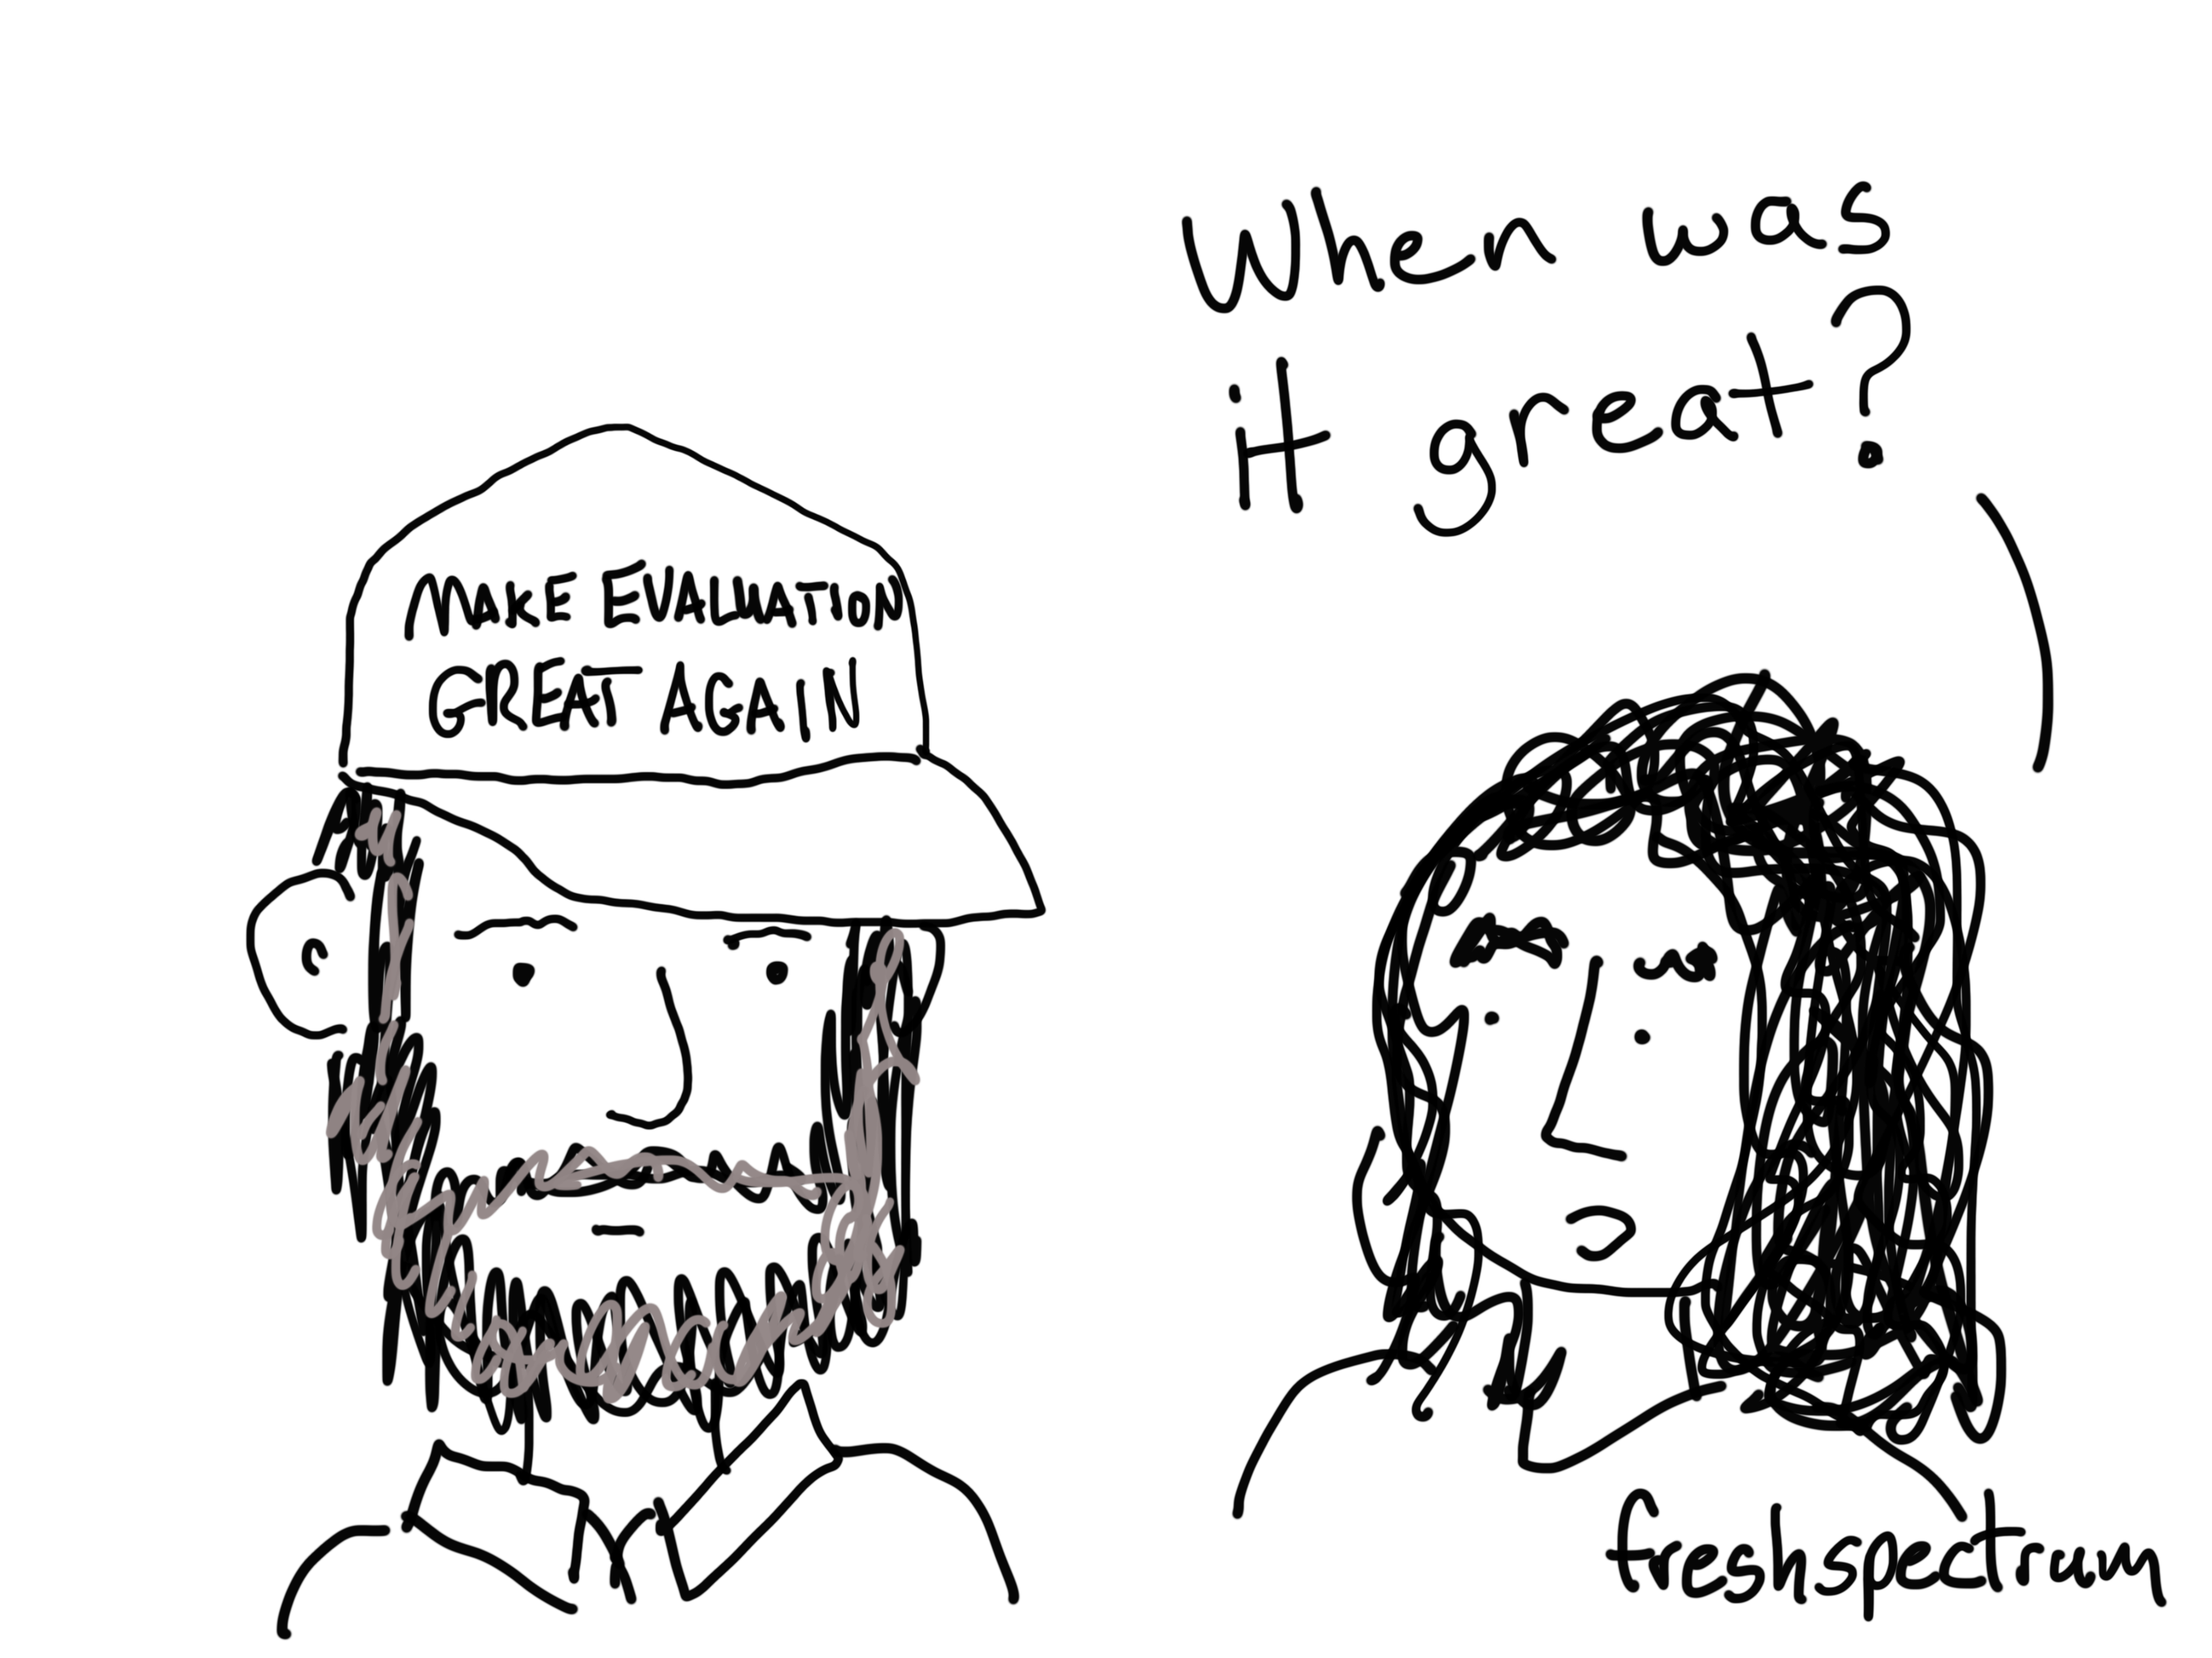
The “oh crap, Trump was elected” cartoon post.
I don’t like cartooning politics. So I often don’t. But after this election… Well, let’s just say I needed to draw and post these before I could draw almost anything else. So here goes… Hey Trump supporter, can I borrow your hat? If Canada were not so cold… This one is for all those upcoming […]

Creating rabbit-hole content
The rabbit-hole went straight on like a tunnel for some way, and then dipped suddenly down, so suddenly that Alice had not a moment to think about stopping herself before she found herself falling down what seemed to be a very deep well. Alice’s Adventures in Wonderland “How can you possibly fit all that we […]
Cartooning #Eval16
*UPDATE* If you attended one of my sessions, I mentioned a coupon code for diydatadesign. Here it is, enter Eval16 when asked for a coupon code and you’ll get the first month for only $5. As in the past several years, I’ll be live cartooning this year’s American Evaluation Association Conference. This post will keep […]
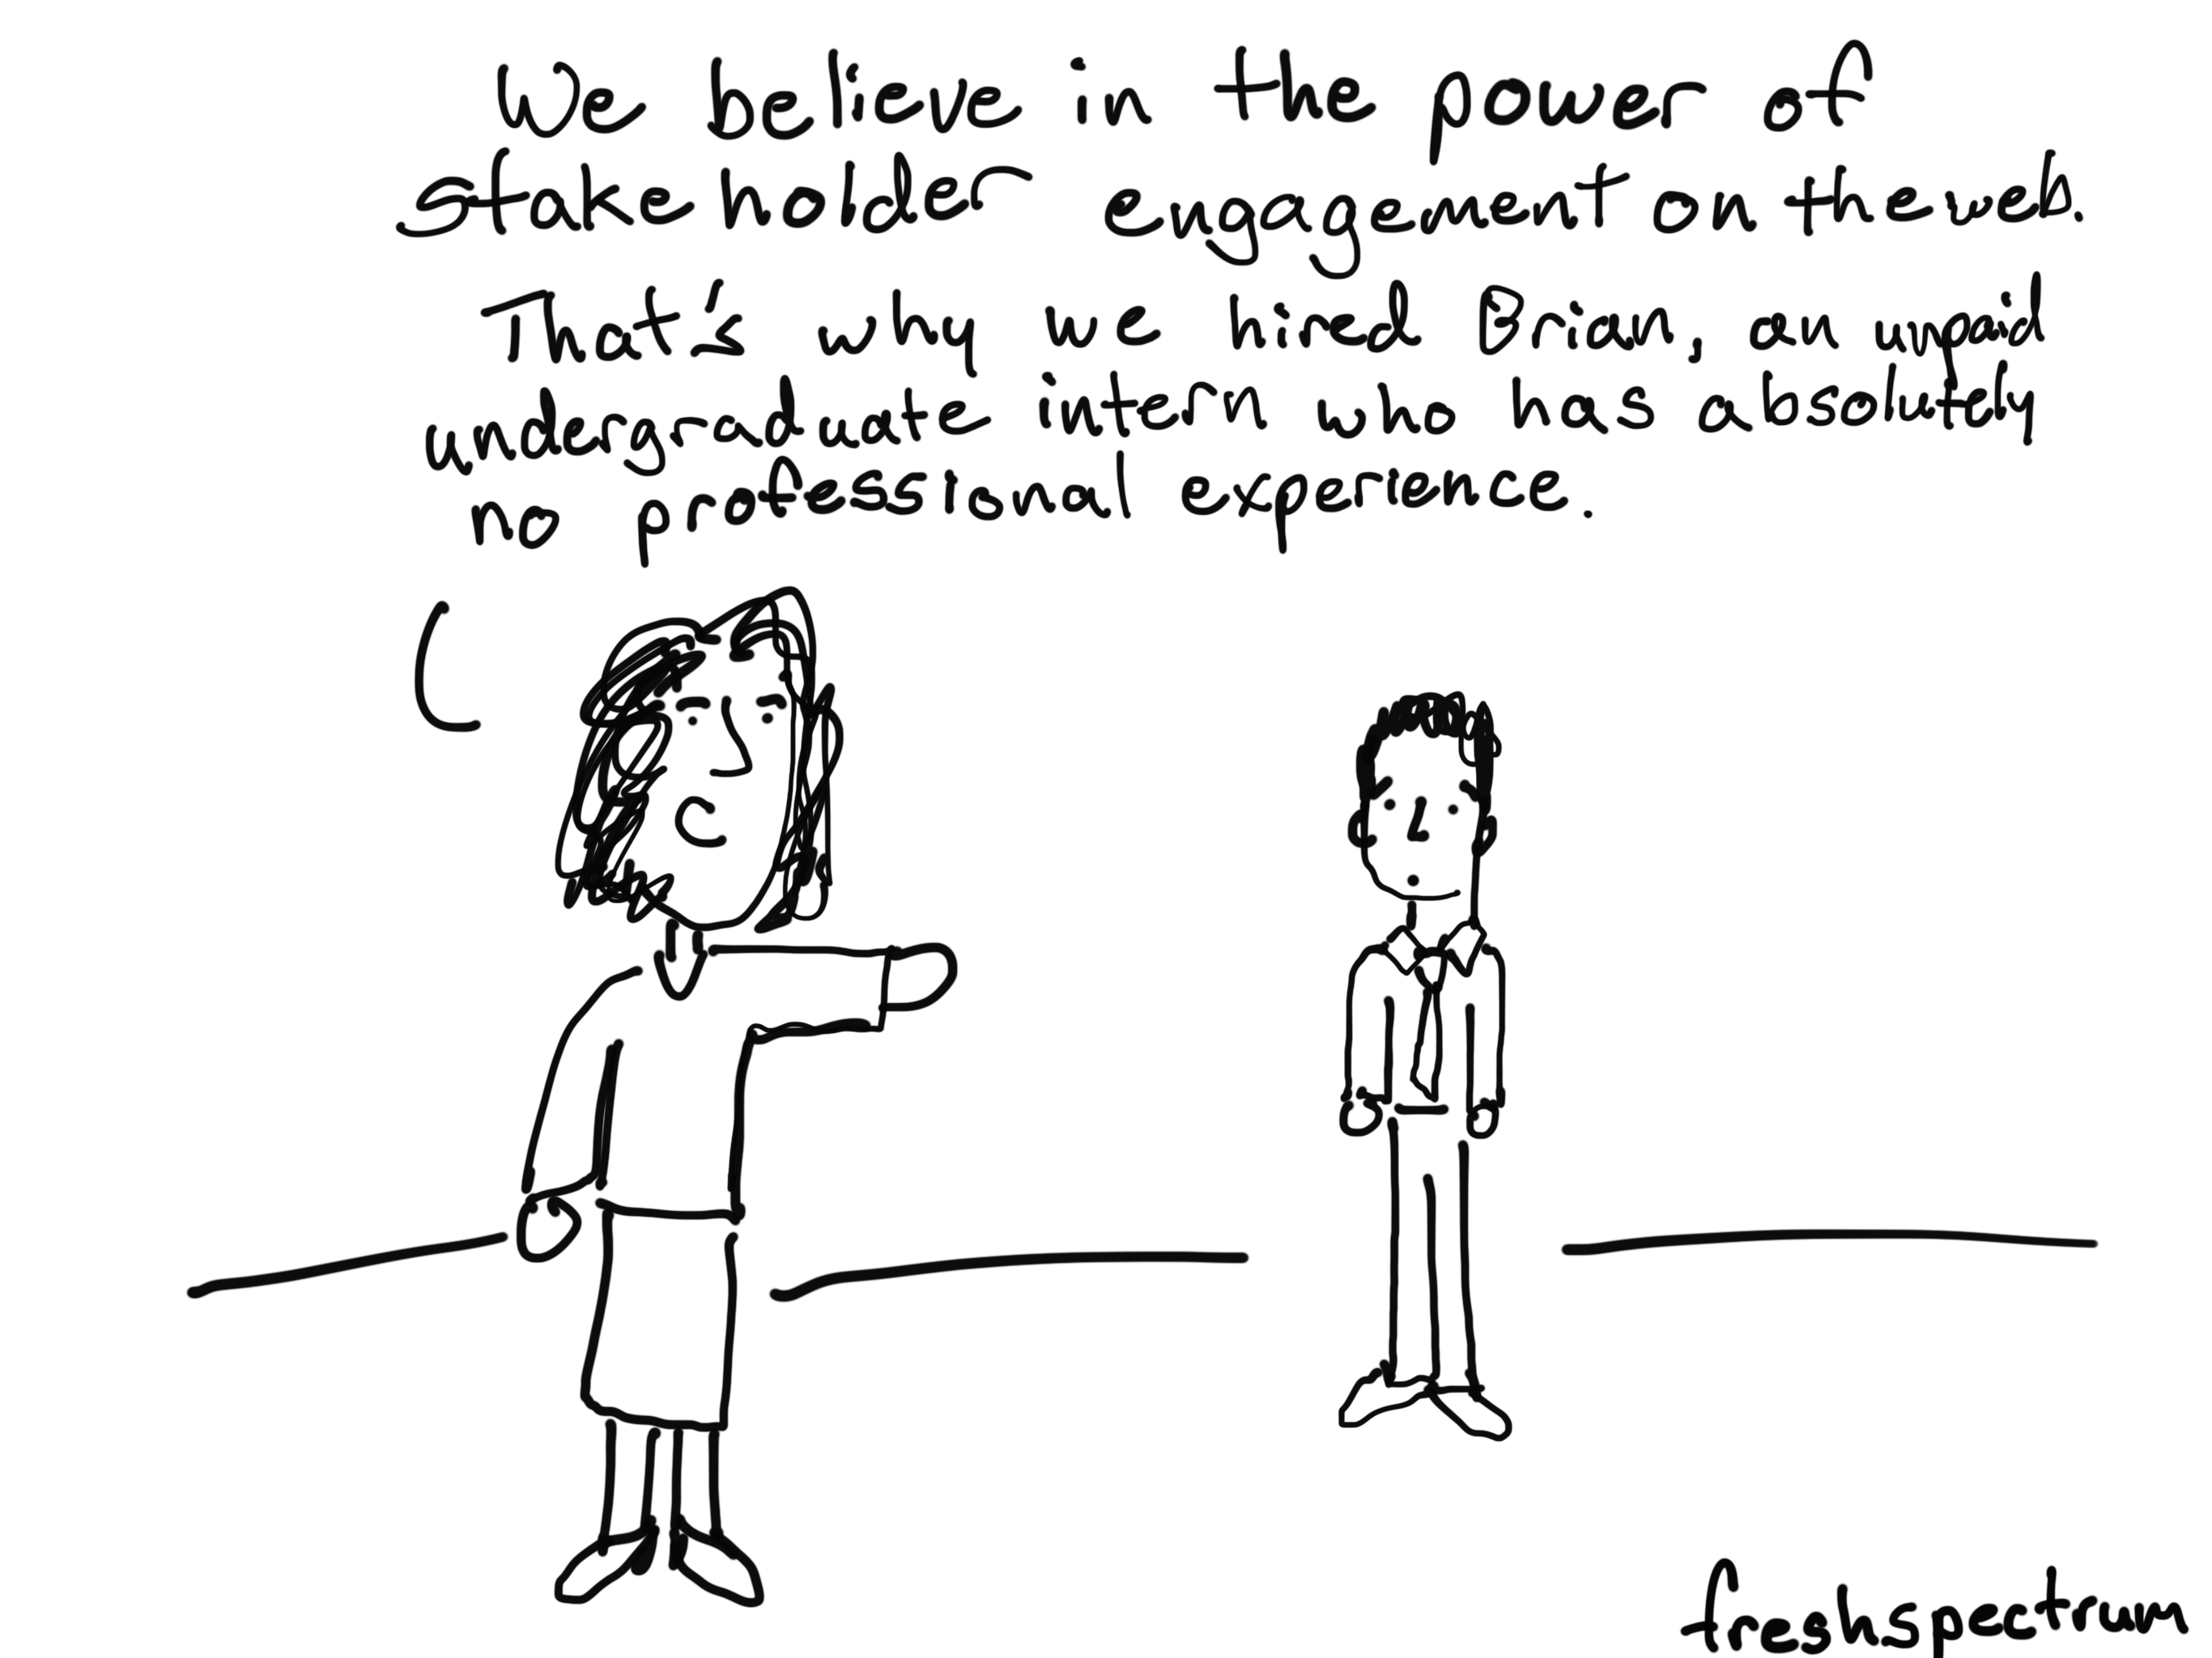
The Content Strategy Problem
Many organizations have a content strategy problem. Their problem? There is no strategy. Our new reporting universe. The web has opened up a lot avenues that organizations can use to reach their audiences. A lot of avenues. To the point that the number of avenues is overwhelming. Off the top of my head, a contemporary professional […]

Serve up Survey Data with a Menu Infographic
During this week’s Thursday discussions over at diydatadesign we’ll be talking about different strategies for visualizing survey data. Preparing for that call inspired this post. The Problem Surveys are not setup in a narrative format. So after the results roll in and it’s time to sit down in a meeting to go over the results, you could be […]

One-Pagers and Free Courses
So I decided to make a few tweaks to my workshop. Instead of offering free weekly webinars, I’m switching to offering temporary free courses. Basically I’ll be making the short animated courses I launch free for their first week. So if you follow my blog closely enough, you’ll get free access to lots of premium content. If […]