
This is the first in a series of posts on data design in Tableau. Today I’ll show you how to use Tableau (Public or Desktop) to create a Dot Plot. This time we’ll use our Dot Plot for an Exploratory Analysis. Visualization is not always just about reporting. Visuals can help you to analyze and […]

What is Formative Evaluation? Cartoon Glossary
This is a series of posts providing quick overviews of important topics in research and evaluation. Each post in this series will include at least 3 cartoons from my archives and at least 3 links to recommended resources. I only give quotes here and recommend that you follow the links below each quote for more detailed […]

How to Create a Sidebar Style One-Pager in Adobe XD
This is the third in a series of posts on data design in Adobe XD. Today instead of charts, I’ll show you how to use Adobe XD as a print design tool for one-pagers. We’ll design a really simple but totally versatile sidebar style one-pager. What you’ll find in this post: An Oversimplified How To […]

What is Developmental Evaluation? Cartoon Glossary
This is a series of posts providing quick overviews of important topics in research and evaluation. Each post in this series will include at least 3 cartoons from my archives and at least 3 links to recommended resources. I only give quotes here and recommend that you follow the links below each quote for more detailed […]
How to Create Icon Arrays in Adobe XD
This is the second in a series of posts on chart design in Adobe XD. In each post we will take on a different chart type. Today we’ll talk about one of my all time favorite charts, the Icon Array. What you’ll find in this post: An Oversimplified How To How to do more with […]

What are Evaluation Questions? Cartoon Glossary
This is a series of posts providing quick of overviews of important topics in research and evaluation. Each post in this series will include at least 3 cartoons from my archives and at least 3 links to recommended resources. I only give quotes here and recommend that you follow the links below each quote for […]

How to Create Bar Charts in Adobe XD
This is the first in a series of posts on chart design in Adobe XD. In each post we will take on a different chart type. Today we start with one of the most ubiquitous and useful charts, the Bar Chart. What you’ll find in this post: An Oversimplified How To How to create a […]
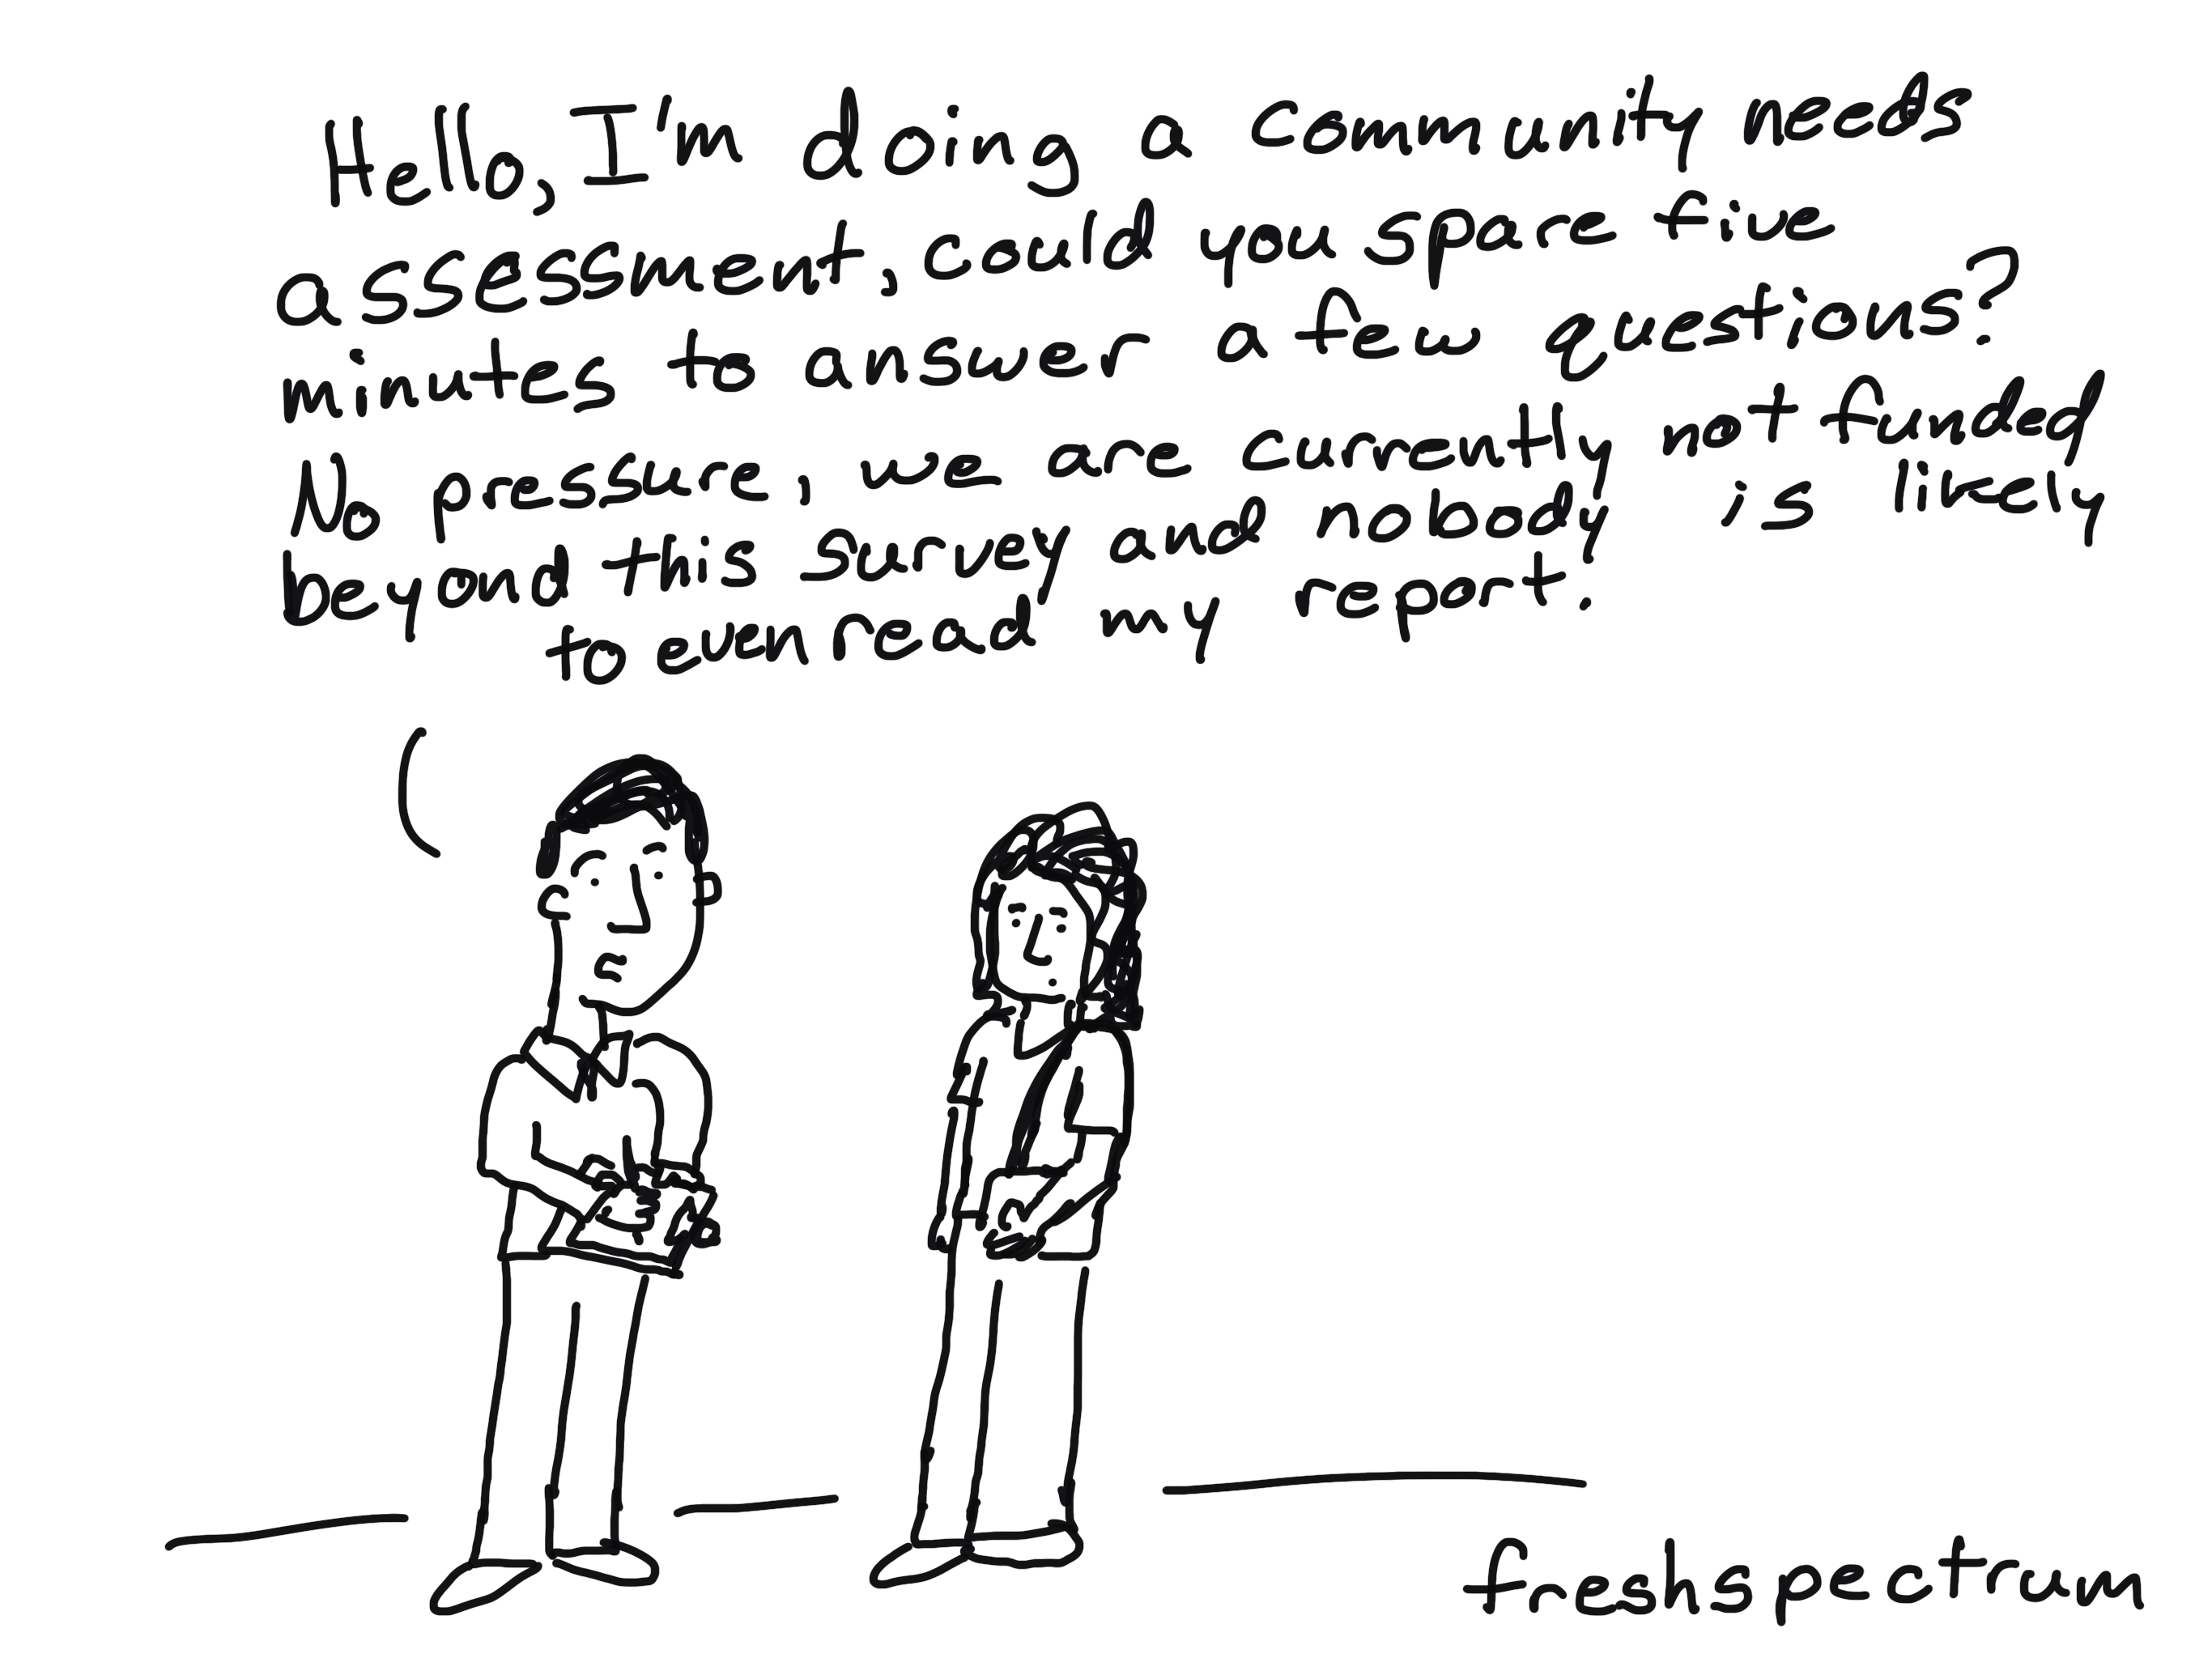
What is a Needs Assessment? Cartoon Glossary
This is a series of posts providing quick of overviews of important topics in research and evaluation. Each post in this series will include at least 3 cartoons from my archives and at least 3 links to recommended resources. What is a Need? In most needs assessment surveys, a need means something that specifically relates […]
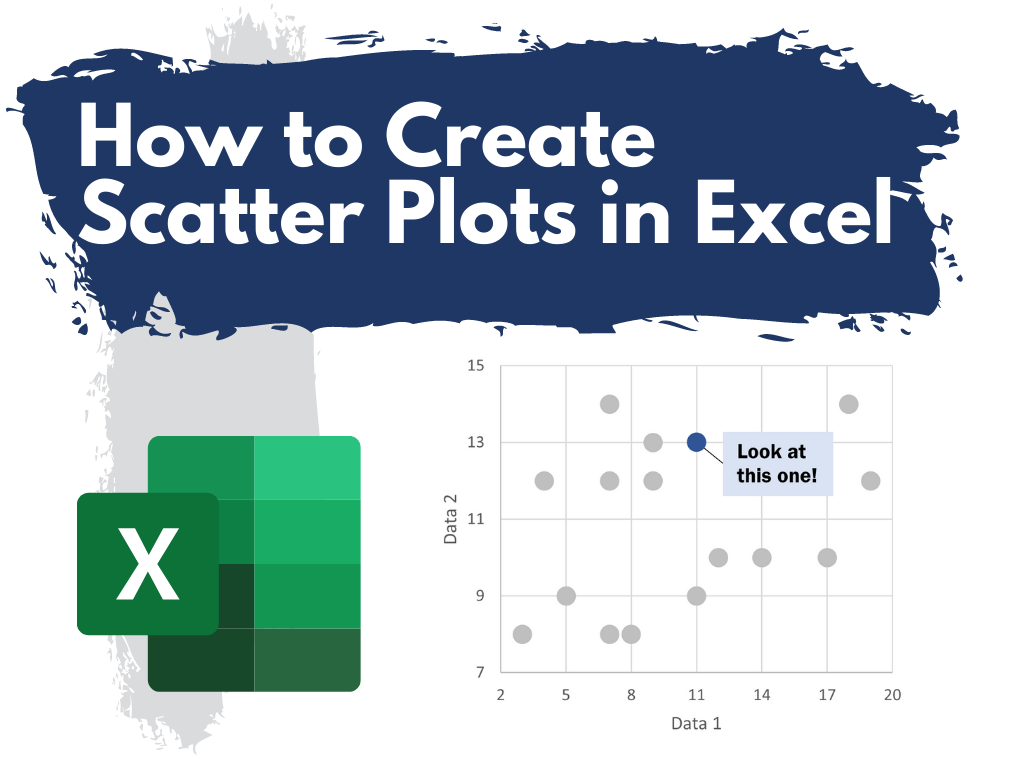
How to Create Scatter Plots in Excel
This is the third in a series of posts on chart design in Excel. In each post we will take on a different chart type. Today we’ll go with the chart that brings correlations to life, the Scatter Plot. What you’ll find in this post: An Oversimplified How To How to create a good looking […]

What is Summative Evaluation? Cartoon Glossary
This is a series of posts providing quick of overviews of important topics in research and evaluation. Each post in this series will include 3 cartoons from my archives along with 3 links to recommended resources. Summative Evaluation can be the Scary One for Program People BOTTOM LINE – Summative evaluation requires rigorous evidence because […]

How to Create Line Graphs in Excel
This is the second in a series of posts on chart design in Excel. In each post we will take on a different chart type. Today we’ll go with a chart that almost always tells a story, the line graph. What you’ll find in this post: An Oversimplified How To How to create a good […]

What is a Theory of Change? Cartoon Glossary
This is a series of posts providing quick of overviews of important topics in research and evaluation. Each post in this series will include 3 cartoons from my archives along with 3 links to recommended resources. Telling the story of a program. A theory of change is a description of why a particular way of working will […]