
Saying that we should budget more money or time towards data design is like saying we should increase teacher pay. You can get a lot of nodding heads from decision makers but when it comes time to actually commit the funds… That’s a no go. So you’re left with a few options. Option 1: Keep fighting the […]
Understand. Reach. Engage. A 3-part digital dissemination strategy
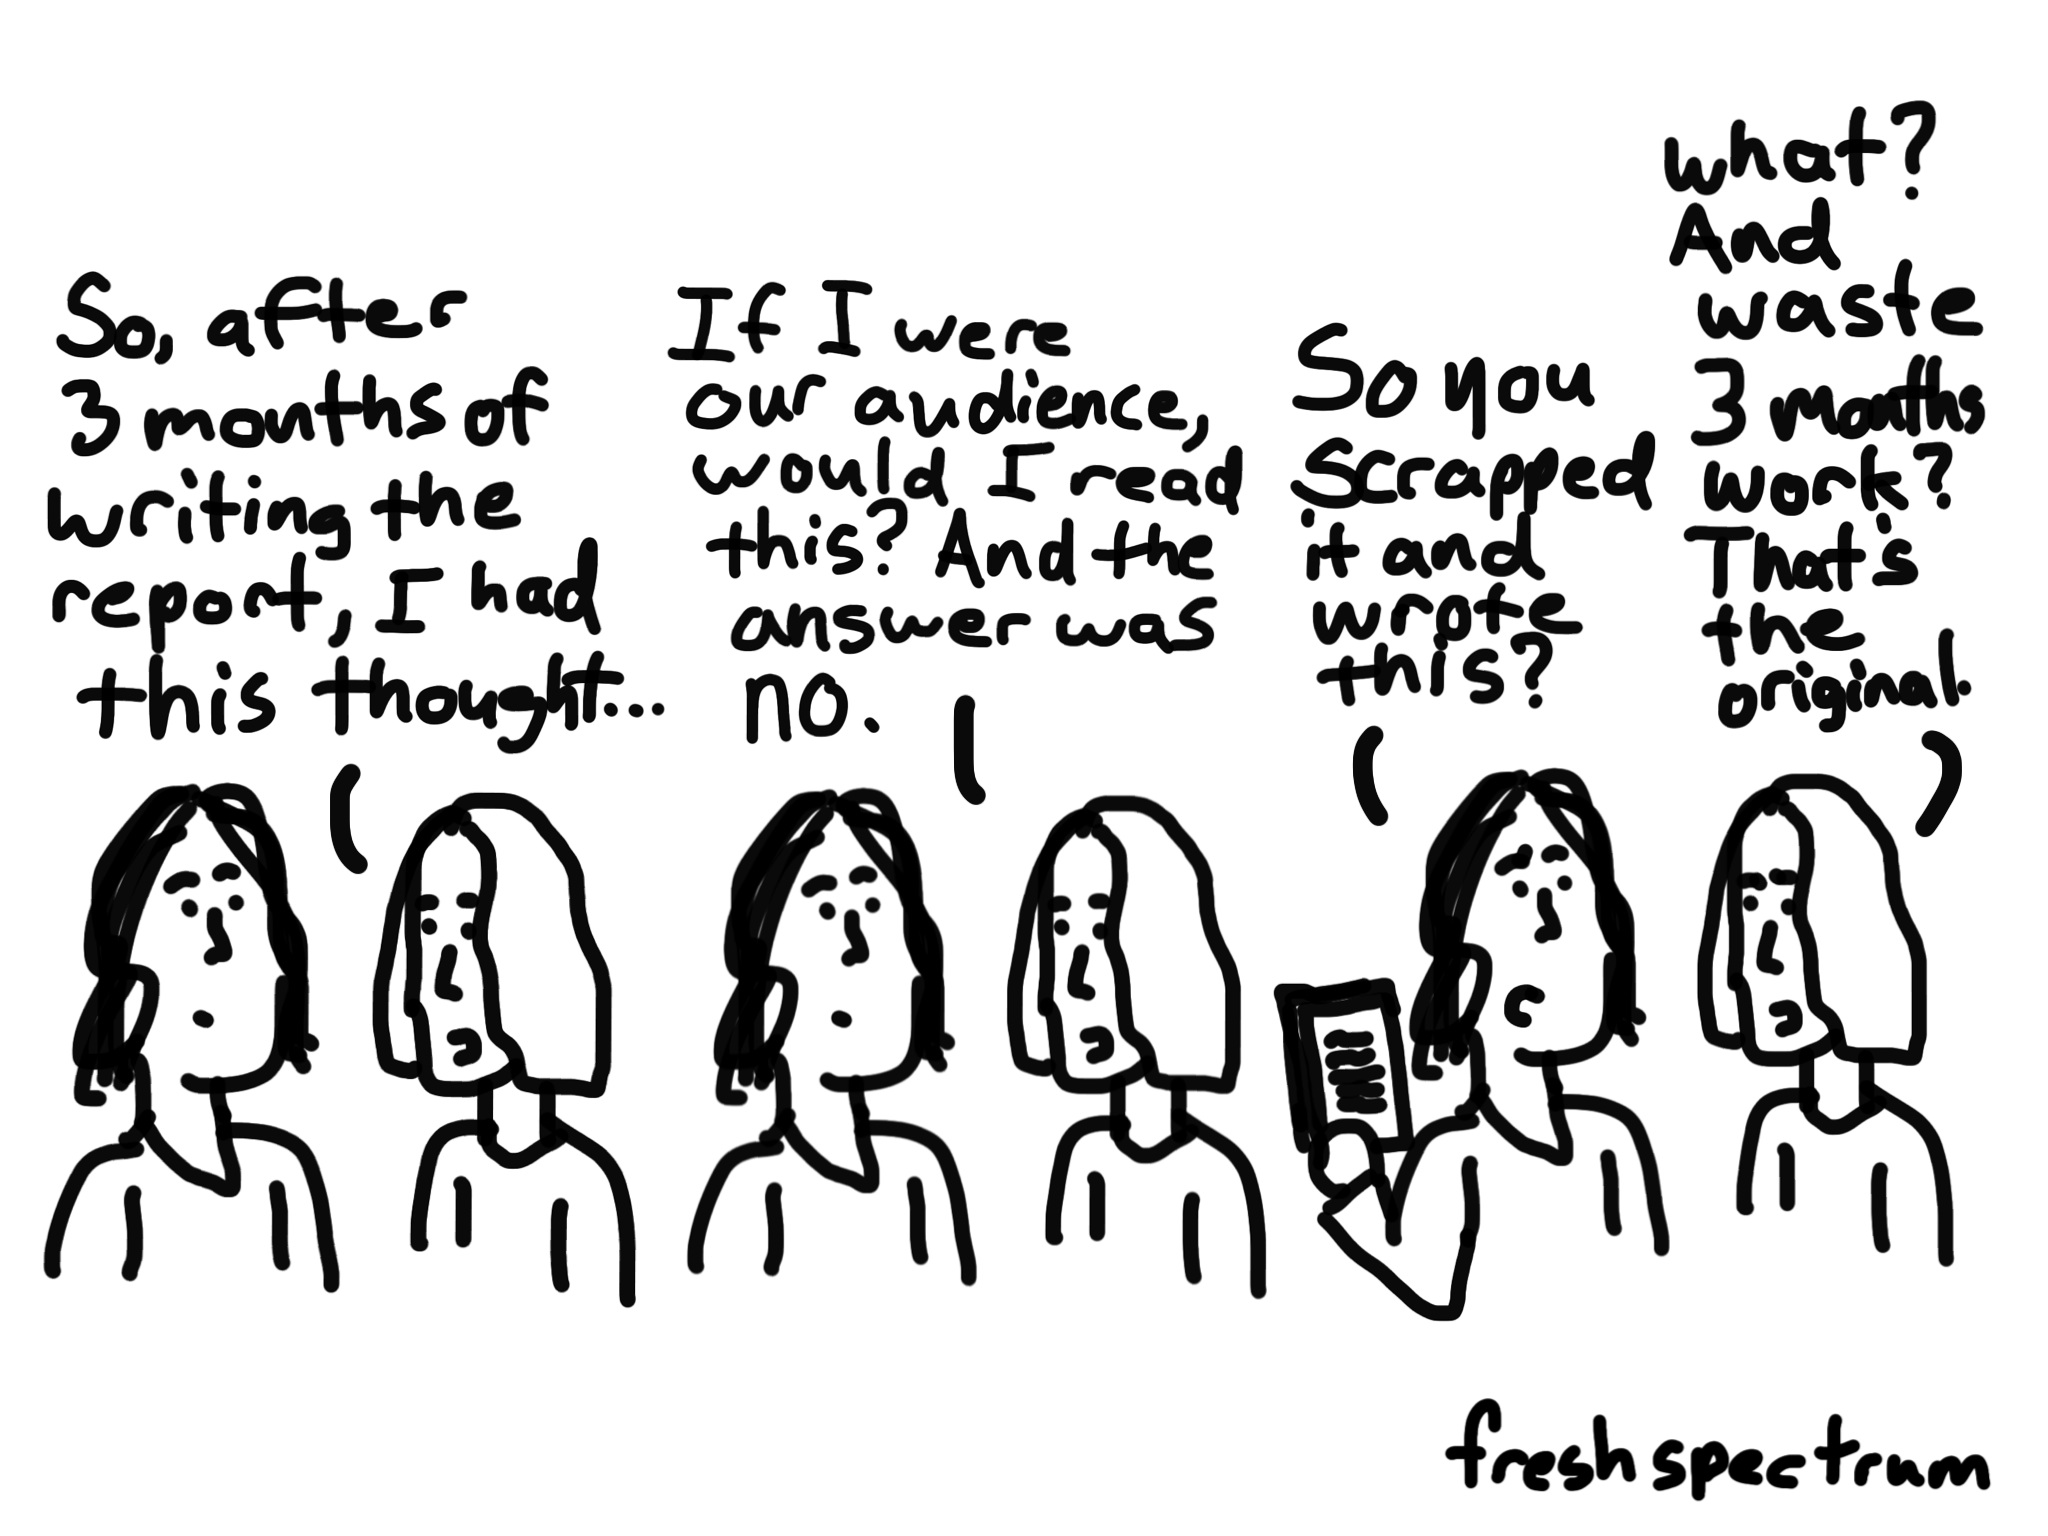
Far too many research and evaluation teams prioritize high quality dissemination like I prioritize learning a second language. It’s definitely on my list of things to do one day, but it’s so far down in priority that unless something changes it will likely never happen. So instead, we keep with the status quo. We write […]

The Dashboard as a Dataset Interface
In practice we see two very different types of dashboards. The first, the literal translation that evaluators tend to latch onto, is the dashboard that gives you all the data you need at your fingertips. These are hard to build because you need to both have the data your audience really needs AND actually understand […]

Reporting for the Small Screen
Just a guess here, but I don’t think smart phones are going away anytime soon. I think it’s time to really start focusing on how we can use the technology as a reporting tool. And stop pretending that it’s not the place where a large number of our stakeholders engage with our programs on a […]

What is diydatadesign in 28 cartoons.
So I’ve been running a digital data design workshop now for several months, and the feedback I’ve received from those inside of it is awesome. But there are a lot of people still on the fence, not sure about what the workshop is exactly, what it involves, or if it’s for them. I get that. […]

Creating GIFs to Explain Charts
So who has time to read the small print? We are in an age where even large print is rarely read. Unfortunately there a lot of really good charts that require at least a little bit of explanation. So how do we convey that information to the audience? Could we use a GIF? What are […]
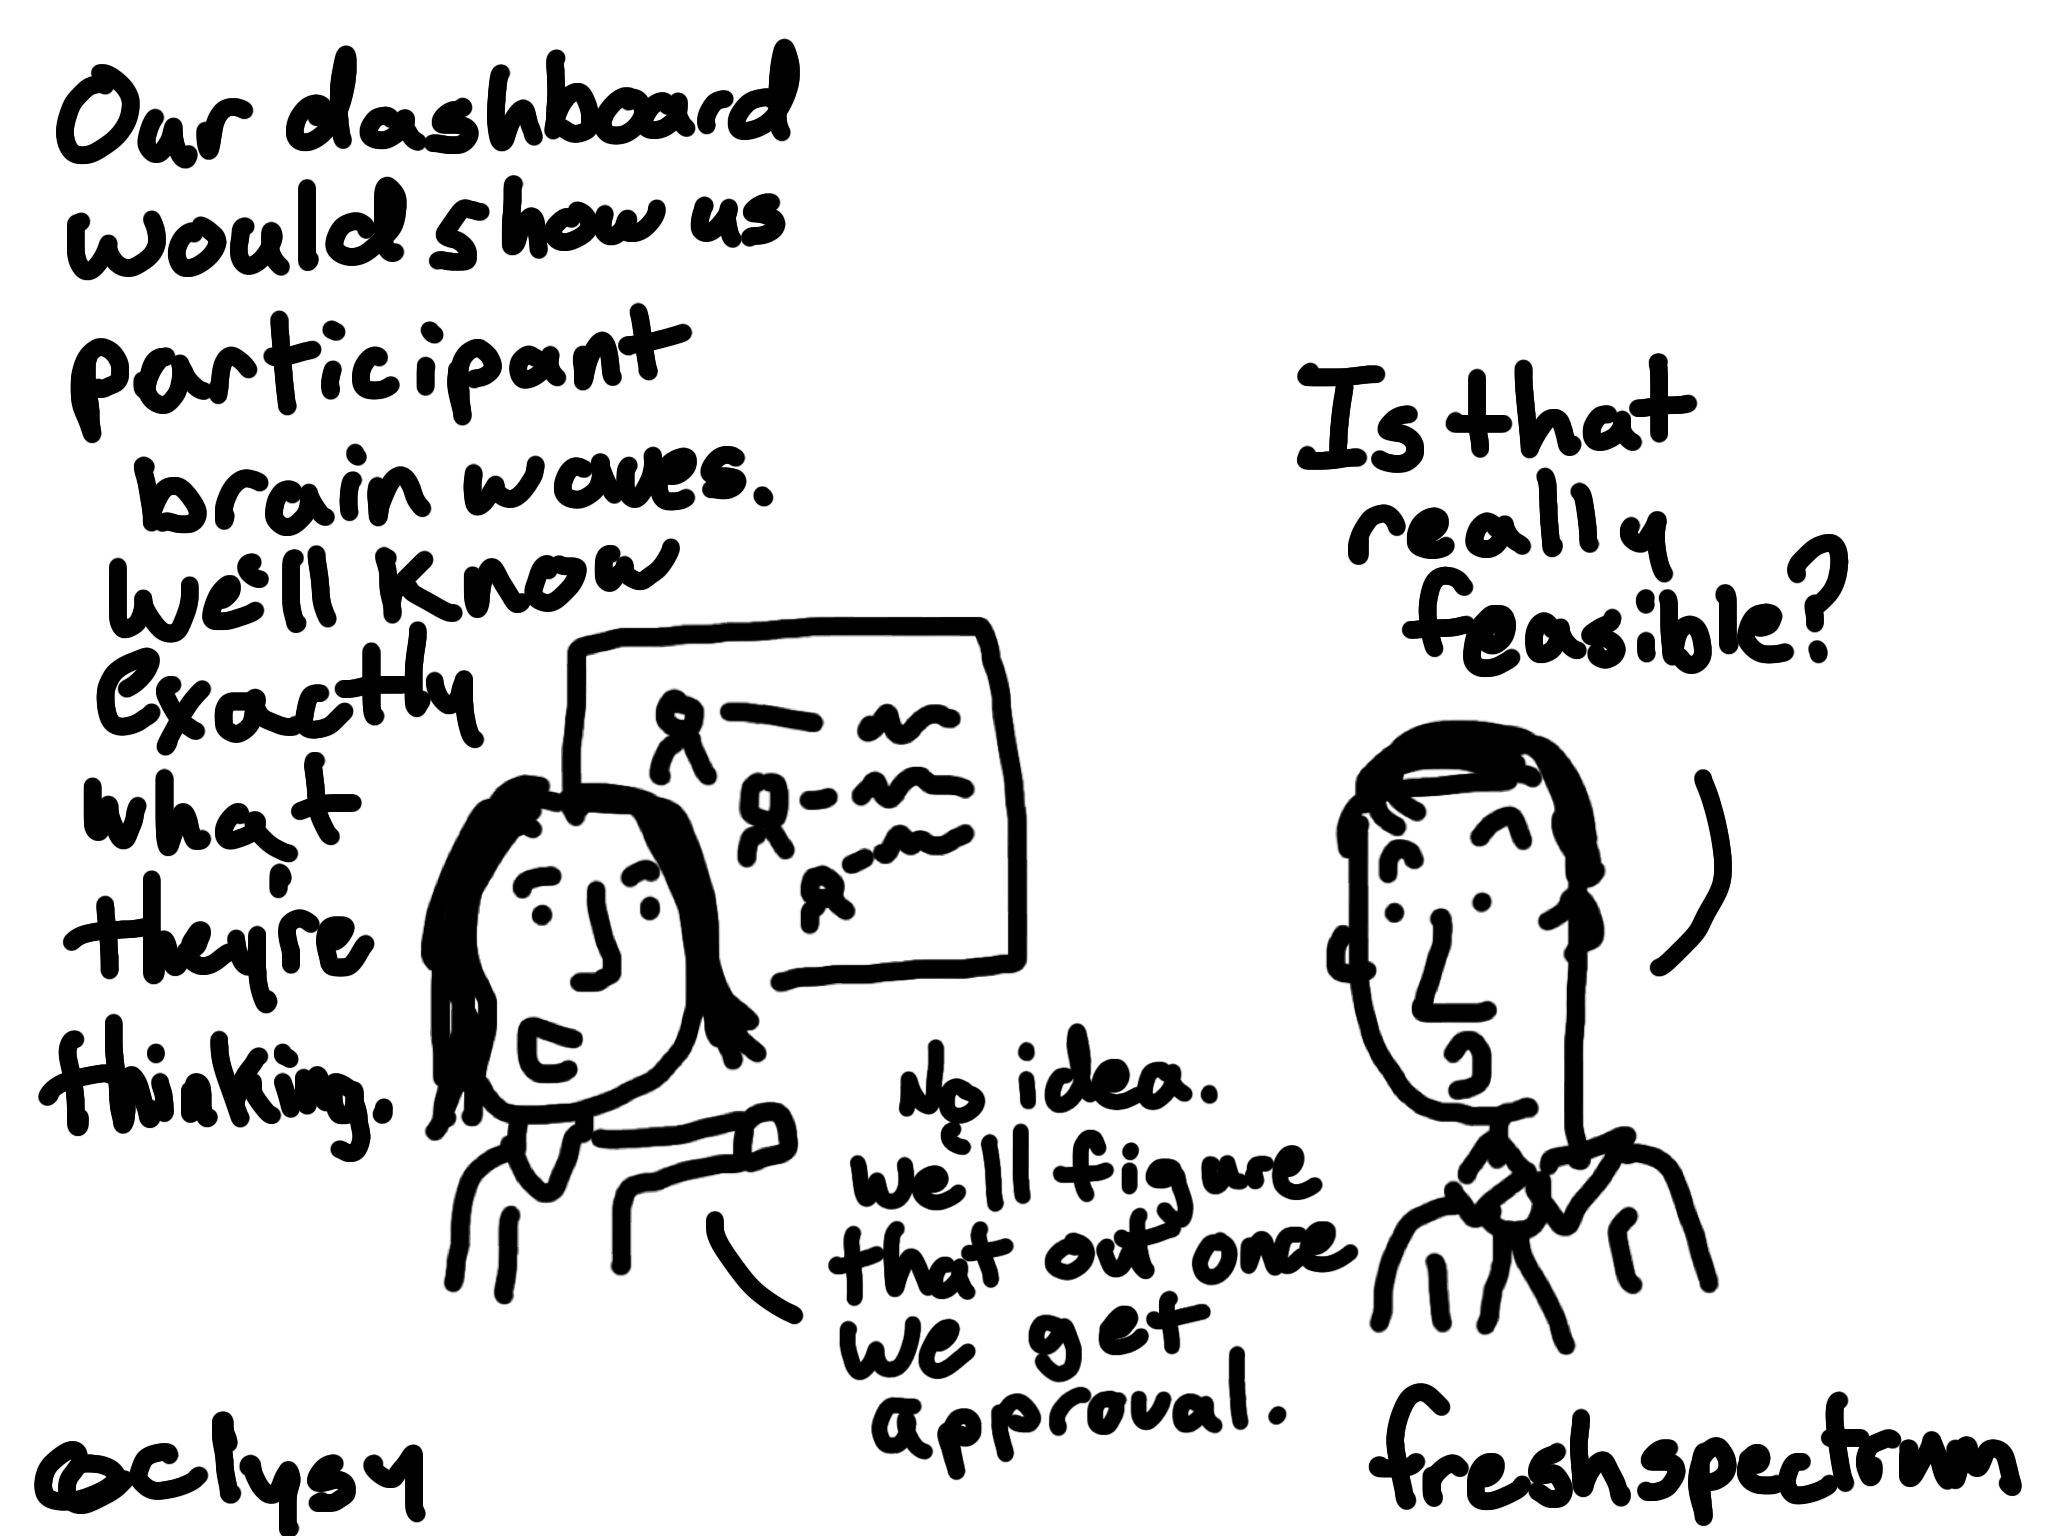
Stop trying to build a dream dashboard
I believe in the power of big dreams. I really do. Want to end world hunger? Awesome. Want to make sure that everyone in your city has a warm/dry place to sleep at night? Fantastic. Trying to build schools in areas devastated by global conflict? Go for it! But a dream dashboard? There is another name […]

Is the long report solution really a one page PDF?
Each morning, before I even put on the coffee, I check my pdf archive. Then I go to work, start up my computer, and immediately check my work pdf archive. Then I keep it on all day, sitting in the background letting me know when I have new pdfs to access. Of course I need […]

In defense of the 200 page report
So I’ve heard a lot of disdain for long reports over the years. They’re easy targets and get picked on often (even I take a shot every now and again). But here’s a secret. I actually kind of like them (shhhhh, don’t tell anyone). It’s not for the reading, I can barely even make it through a […]

A PDF Interactive Logic Model
So the interactive logic model post was a big hit. I kept getting a similar question, so I decided to create a short follow-up. Here goes…I used icons from thenounproject, sketched it all out in Adobe Illustrator, and created the interactive prototype using Invision. But… Interactivity can be accomplished a bajillion and one ways. Some of […]
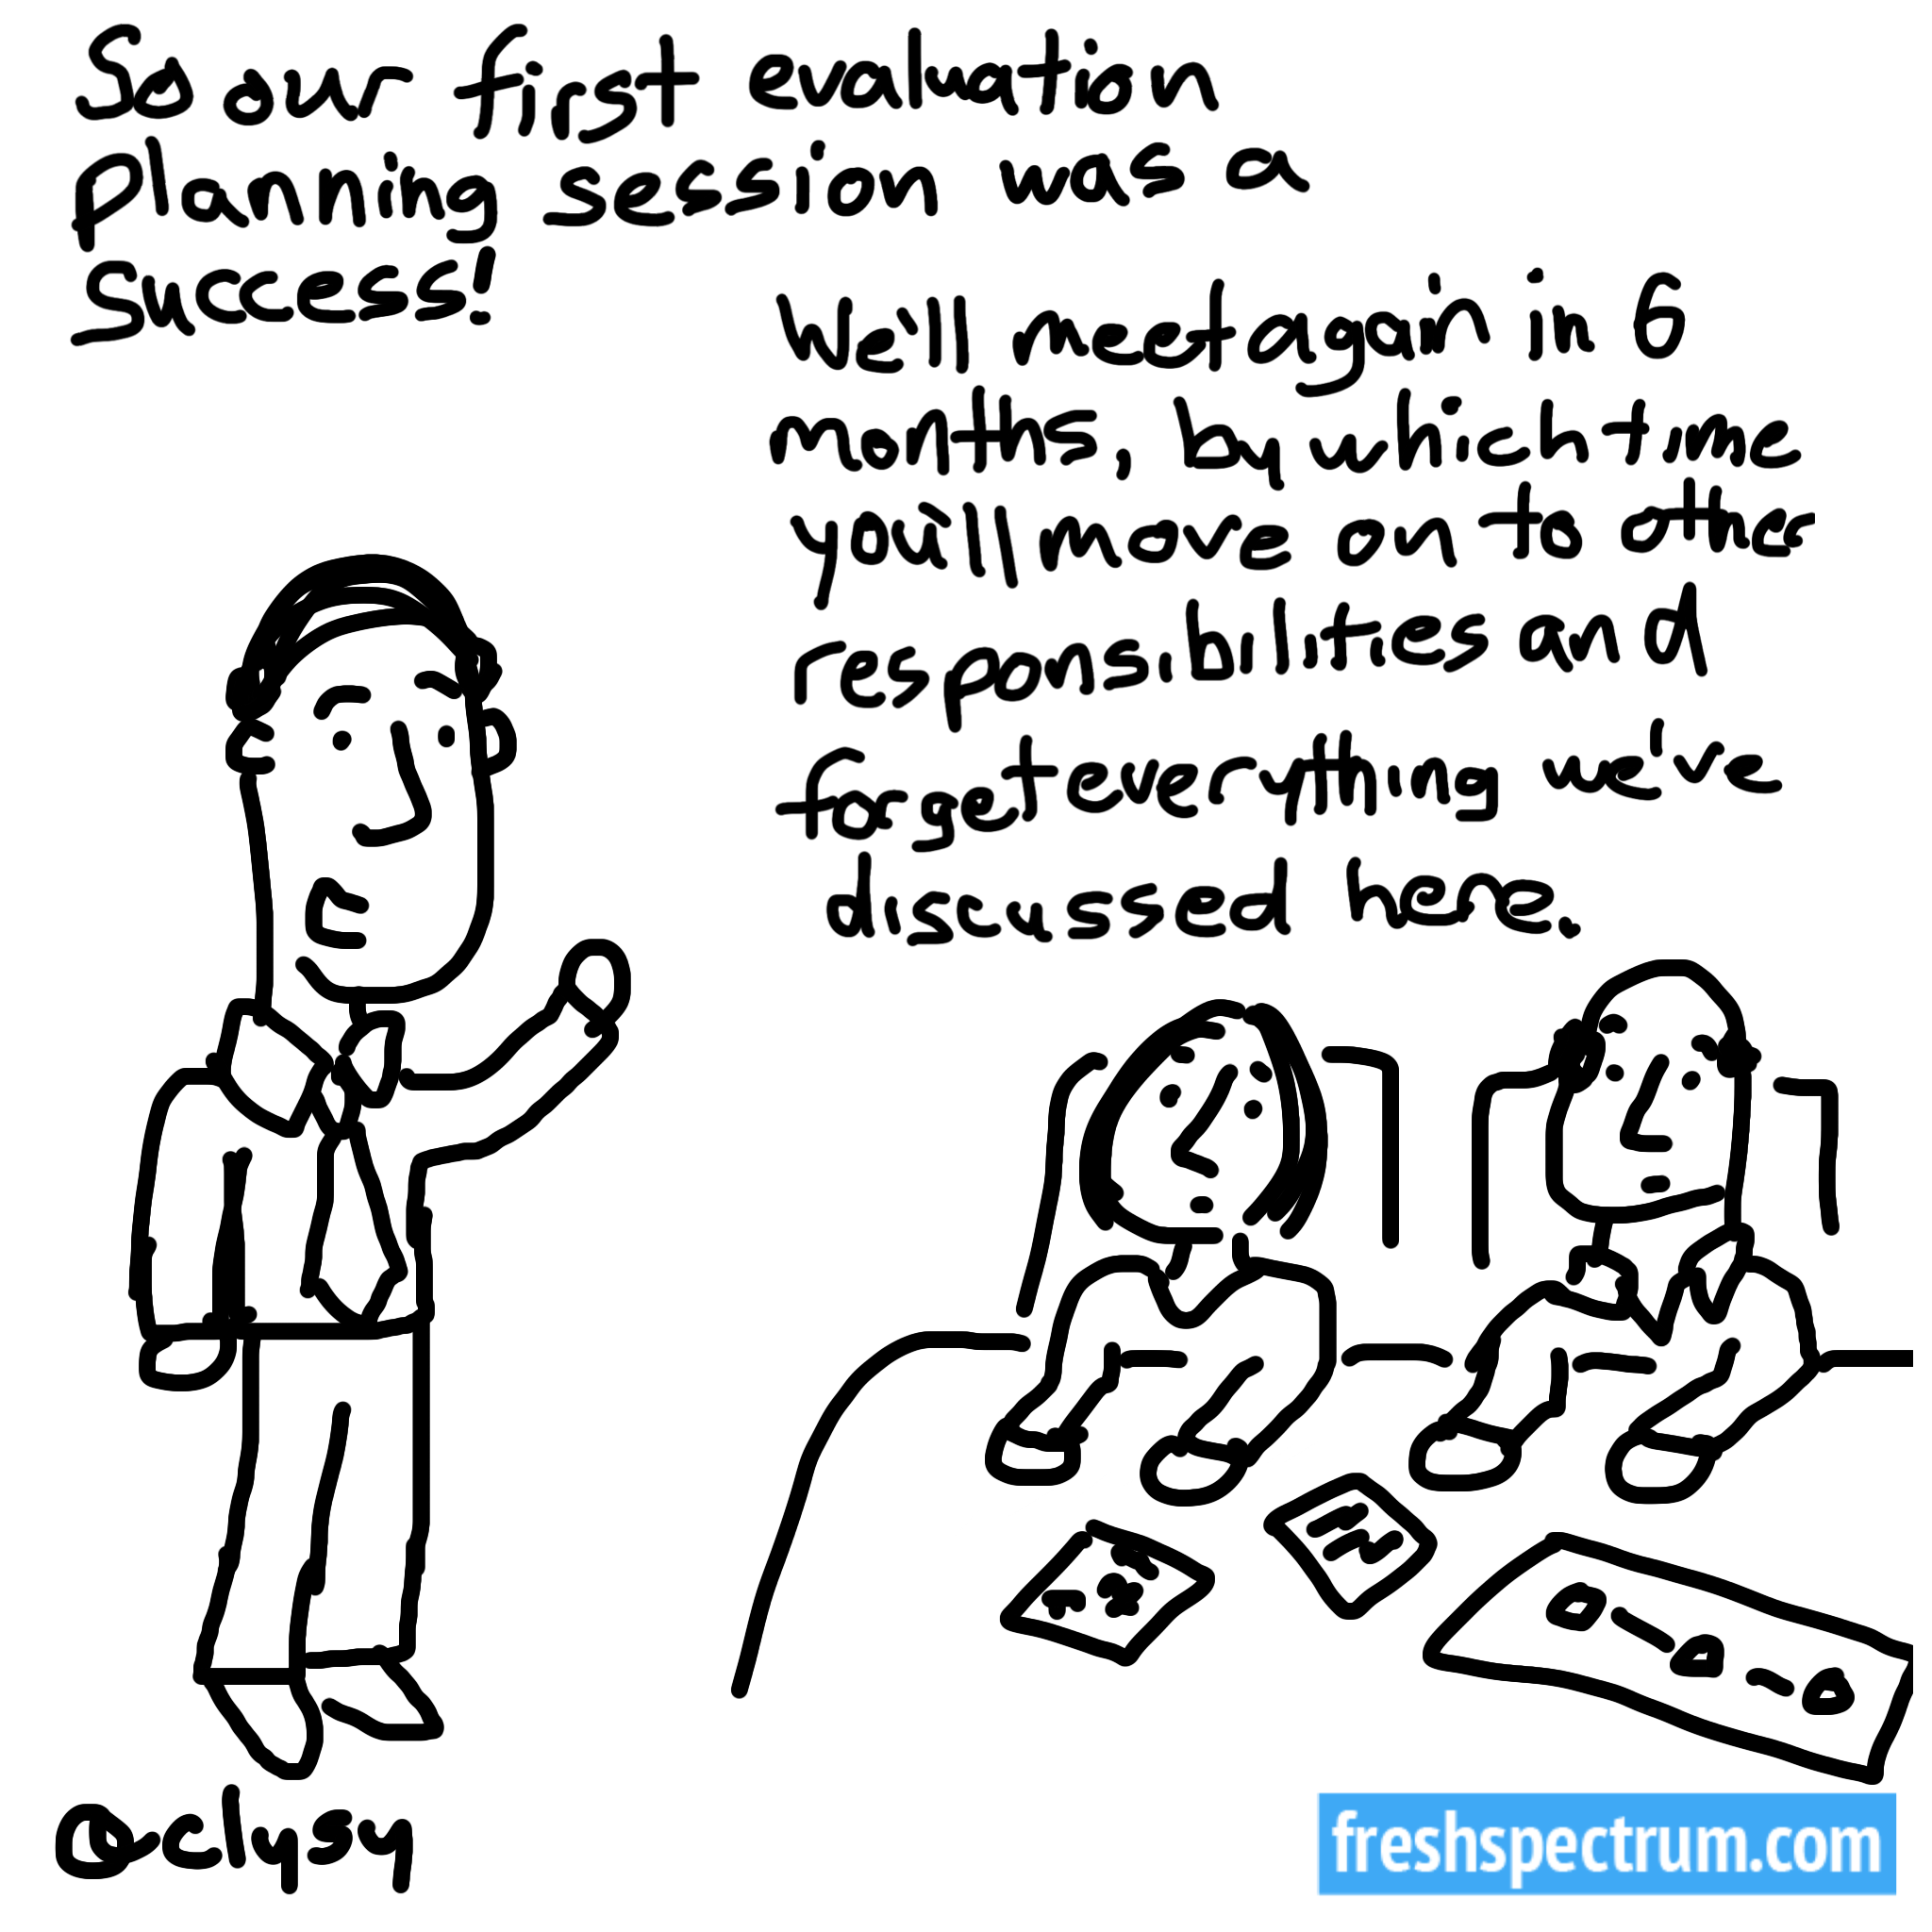
Creating a hand drawn interactive dashboard for evaluation planning
It’s too bad we can’t create nice little interactive dashboards to support all of our work. You know, as a way to kind of pull everything together and make our team’s (and client’s) lives just a little bit simpler. Especially in those early planning days, where we see lots of little iterations. Wouldn’t that be […]

Creating a Visual Interactive Logic Model
A logic model, or theory of change, is one of the most common forms of visualization you’ll find in any evaluation report. They can be critical in helping a program or project think through the underlying logic of how it’s supposed to work. But when it comes time to share or disseminate the diagram, that’s where […]