My ADHD break can be a jerk sometimes. On the upside, it gives me a million things I can do. That’s also the downside, because faced with too much stuff my ability to do anything goes down to zero.
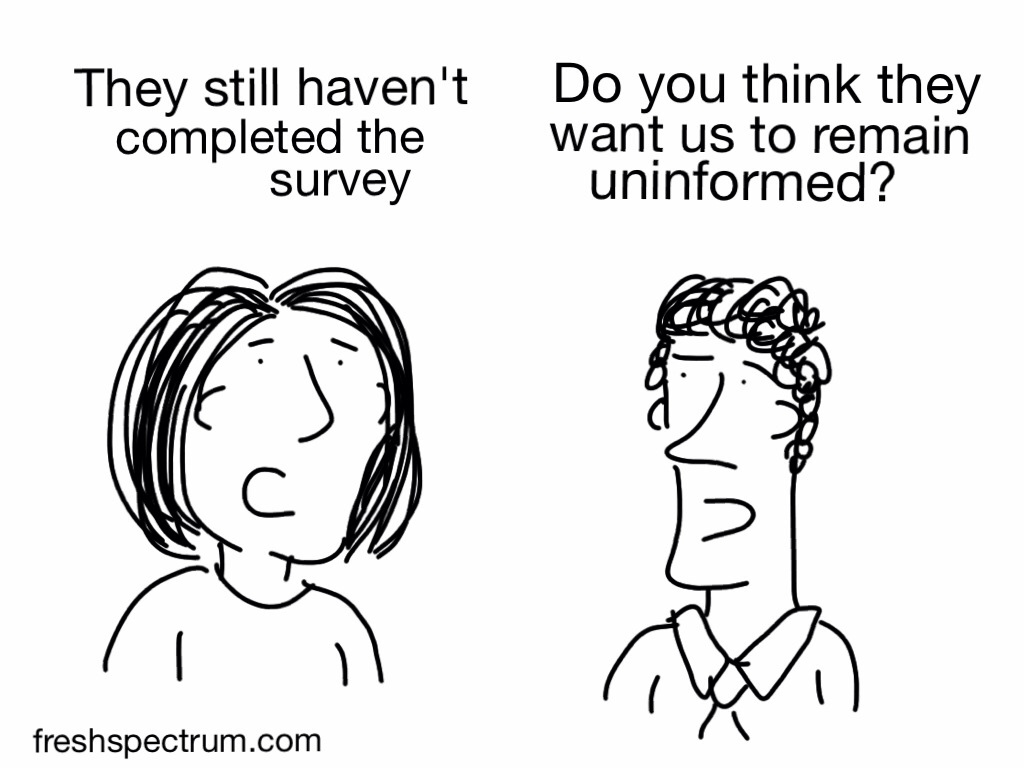
So I sent a survey to my email list.
What the survey asked.
In the survey I asked people to rate 6 of the things I create on a scale of 1 (don’t care) to 5 (love it).
- Data Design Quick Tips & Step-by-Step Tutorials.
- Comics & Cartoons.
- Blog Posts (Personal Essays)
- Blog Posts (Before & After Designs)
- Challenges & Practice Activities
- My Email Newsletters
I also asked if there was anything I didn’t mention that people wanted more of. And a bonus question about their biggest struggle.
As of yesterday I had 103 responses. And if you were one of them THANK YOU! I really do appreciate you.
What I learned.

I have a split audience.
This isn’t to say people showed real ambivalence to any of my stuff but you could definitely pick up on some preferences. If you were really into my comics, you were less likely to be into my before & after posts. If you were really into tips and tutorials, you were less likely to appreciate the personal essays.
This let me segment the responses into four groups.
- Superfan (n=47): The people who gave high scores across the board.
- Practical/Technical (n=22): The people who gave highest scores to Tips, Tutorials, and Before & After blog posts.
- Personal (n=22): The people who gave highest scores to comics and personal essays.
- Casual (n=12): A high score on maybe one thing, but mostly middling scores.
Most people enjoy the comics (Overall mean = 4.43).
69% gave comics a 5 (love it), including 94% of superfans. This was the casual segments highest rated content type. Only the practical/technical group had a mean lower than 4 (mean = 3.23).
I have been wondering if the comics were getting old for ya’ll, but I don’t really see any signs of that in this data.
You don’t want homework (Challenges & Practice Activities overall mean = 3.26).
This was the only question on the survey that had more 1s, 2s, and 3s than 4s and 5s. Even the superfans, who had the highest mean, were a bit blah on challenges and practice activities (mean = 3.5).
This result feels like a hindsight is 20/20 kind of thing. I’ve said for years now in workshops and presentations that rule number 1 is everyone is overwhelmed. And you know what an overwhelmed person never wants to do? More work.
I’ve been underserving the Practical/Technical
When it comes to my newsletters, they do well with the Superfan (mean = 4.17) and Comics & Story (mean = 4.23) segments. Not as well with the Casuals (mean = 3.5) or Practical/Technical (mean = 3.64) crowd.
Thinking about my newsletters over the last year or so, this split makes a lot of sense. I haven’t been creating as many tutorials or regularly sharing data design tips directly in the newsletters. At the same time you can always expect to find a comic and a little bit of from-the-heart writing in every email. So that’s a gap, and I plan to fix that.
There is a lot of struggle. But also a real desire to improve communications and dissemination skills.
I added one of my favorite questions as a bonus. “What’s your biggest struggle right now?” 74% of respondents took the time to write me something with responses ranging from just a few words to short essays.
I’ve read through all of your comments, your challenges, your stories, and your kind words. So thank you for that, it means so much to read your words.
This is rich information and I’ll be digging through it for awhile. But there were certainly some common challenges.
Time is one common challenge.
“Knowing that I’ve overcommitted professionally, leaving little to no time for creative work.”
“Properly designing reports under severe time crunches.”
“Everybody wants something different, I have to respond to all of it, I also need time for the dogged, careful, hard work to actually understand the program.”
“time frames”
“Not enough time or energy.”
They heaviness of the world is another challenge.
“Continuing to do the work I love while navigating a fascist regime.”
“Motivation. The world feels heavy and when I go all in (as many evaluators), stress goes up fast. Summer fun has made me want to protect my peace more (even as I feel guilty about that!).”
“Finding any optimism about international or community development programming in the face of so many brutal cuts (and I’m not even in the USA) and no positive signs on the horizon.”
“1) yt supremacy culture, and 2) the crushing despair of climate destabilization”
Creating useful reports, with a budget.
“Making eval reports that are TRULY usable and meet a clients where they are (what they’re asking for, their data literacy, etc) while also meeting the bar of rigor“
“COMMUNICATING program impact that will move organisations to fund!“
“How can I build the case that no one is gonna read these annoying, dry, long reports?”
“Our clients have limited funds right now, and they’re choosing to invest in evaluation (we love!). They’re looking for the biggest bang for their buck (fair enough!). They often have many audiences in mind for the findings but the budget for one report or deliverable (eek!). We’re experimenting a bit with modular reports to somewhat address this, but creating something that will make everyone happy is a fool’s errand…“
The AI Elephant in the Room.
“Clients who believe AI can produce excellent reports without much or any intervention.“
“Should I use AI for evaluation work? Specifically, for what? How do I address the related ethical and technical issues, as well as data privacy concerns? How do I ensure that the AI doesn’t come up with nonsense without me noticing?”
“Ability to effectively use AI for data analysis and incorporate AI into product lifecycle and deliverable workflows. My biggest struggle is scaling this up so that other team members have the skills to be able to do this as well.“
My Action Plan.
1. Serve all my audiences.
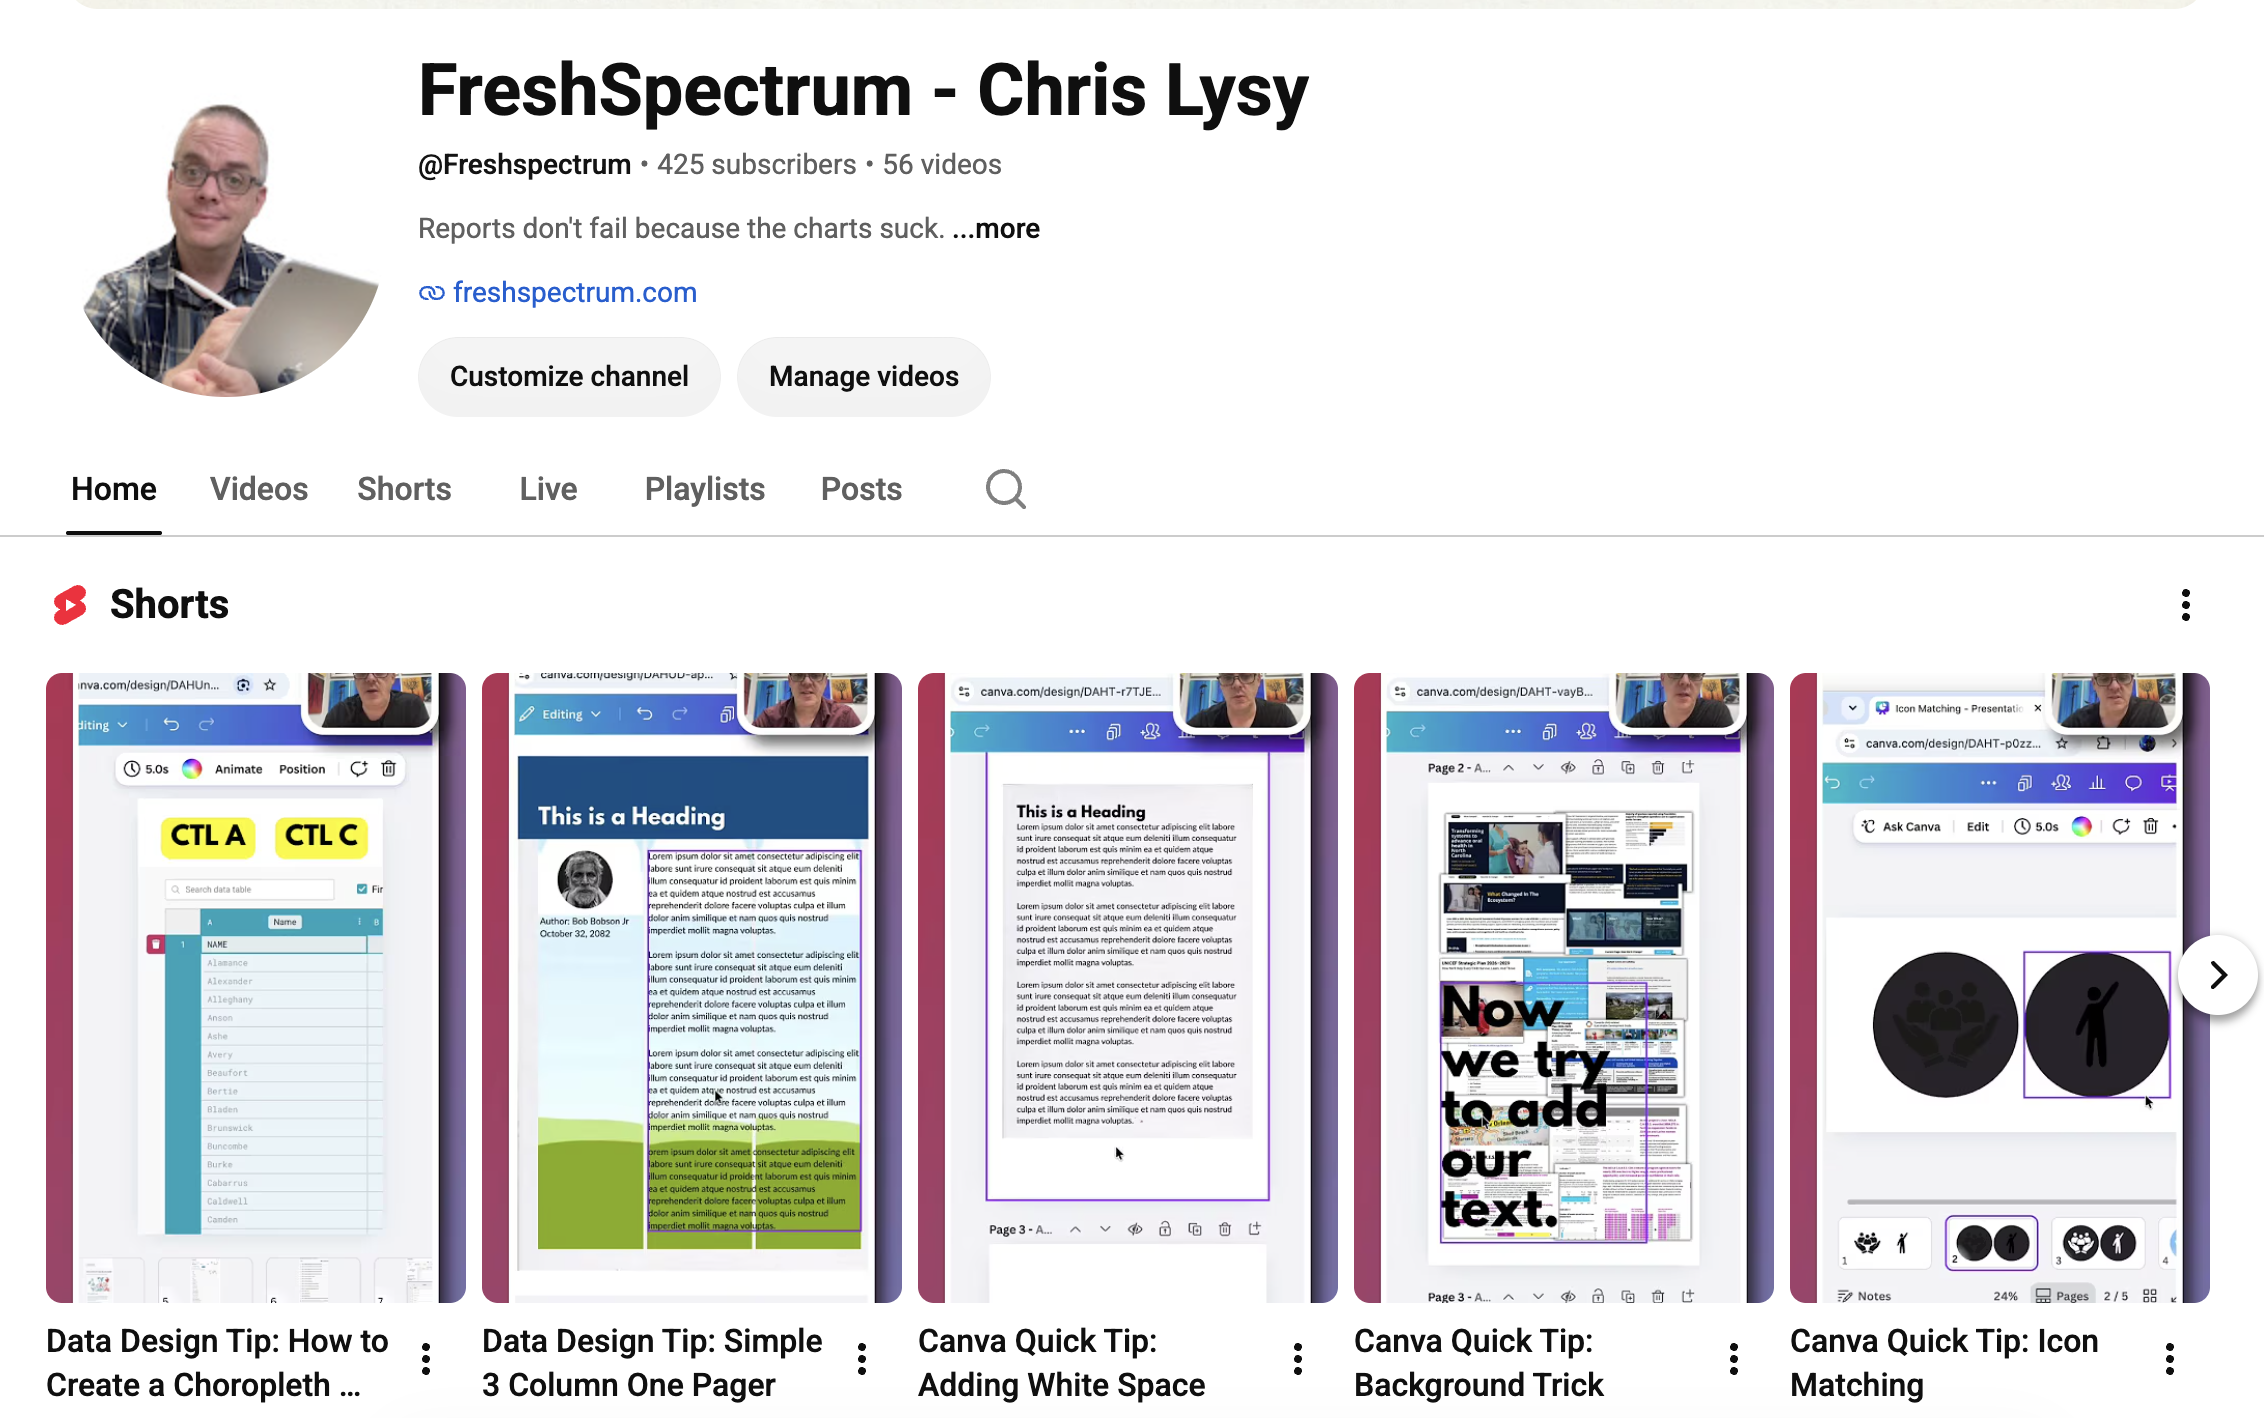
You can expect to see more tutorials, short courses, and quick tips. I’ve already started a new series of YouTube shorts with data design tips delivered in under a minute. I have lots more planned.
I’ll still be writing personal essays and drawing comics. But my newsletter will also always include support for those of you looking for practical data design advice.
2. Prioritize easy.
Less homework, more inspiration. The goal will be to give you enough to get into something if you have the time. But also enough that you get something out of it even if you don’t have the time.
3. Actually schedule some of my workshops.
Right now my workshops are in waitlist mode. I’ve read your comments and will be scheduling some actual public sessions in the near future.
4. Keep Drawing
People still like the comics. So I will give the people what they want.
FYI, I’m going to keep the survey open for a bit.
If this is your first time hearing about the survey (or you heard about it and forgot to respond) no worries. If you would like to take the quick survey, share your own struggle, or just give me a little feedback I’ll keep it open for a little while.