Have you ever heard of social objects? I talk about them every once in while here, but probably not enough given how important I think they are in the spread of information. Social objects are anchors …

What is a quadrant graph?
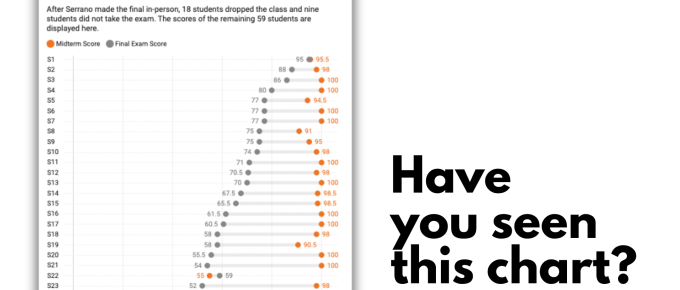
Interactivity can really elevate certain charts, graphs, and illustrations. In this series of posts I will be highlighting visuals that work particularly well within interactive reports and data …