
My preferred way to create a dashboard is to start with something simple, crude even. Then over time, adapt. The faster the dashboard goes live, the better. This is the way most web software is built. Always in beta, changes are then made based on the needs of the users. Many organizations put in most […]

Can you influence your dashboard?
A lot of organizations get tied up with the whole “car dashboard look.” That’s all surface area stuff. Real dashboards give us access to information we can use to make decisions. Our actions should also be able to influence the data. Fuel gauges and speedometers give us data we can influence through our actions. Do […]

The Original Qualitative Visualization
I’m pulling from my archive this week. Cartoons will be all about data visualization.

Realist Recipe
This is the last one I’ll be sharing at this moment. Starting tomorrow I’ll be moving onto a different topic. Over the next couple of weeks, I’ll be sharing 10 of the cartoons I created for the Rameses Project on realist evaluation. Visit that site to get access to the full collection. If you’re at all interested […]
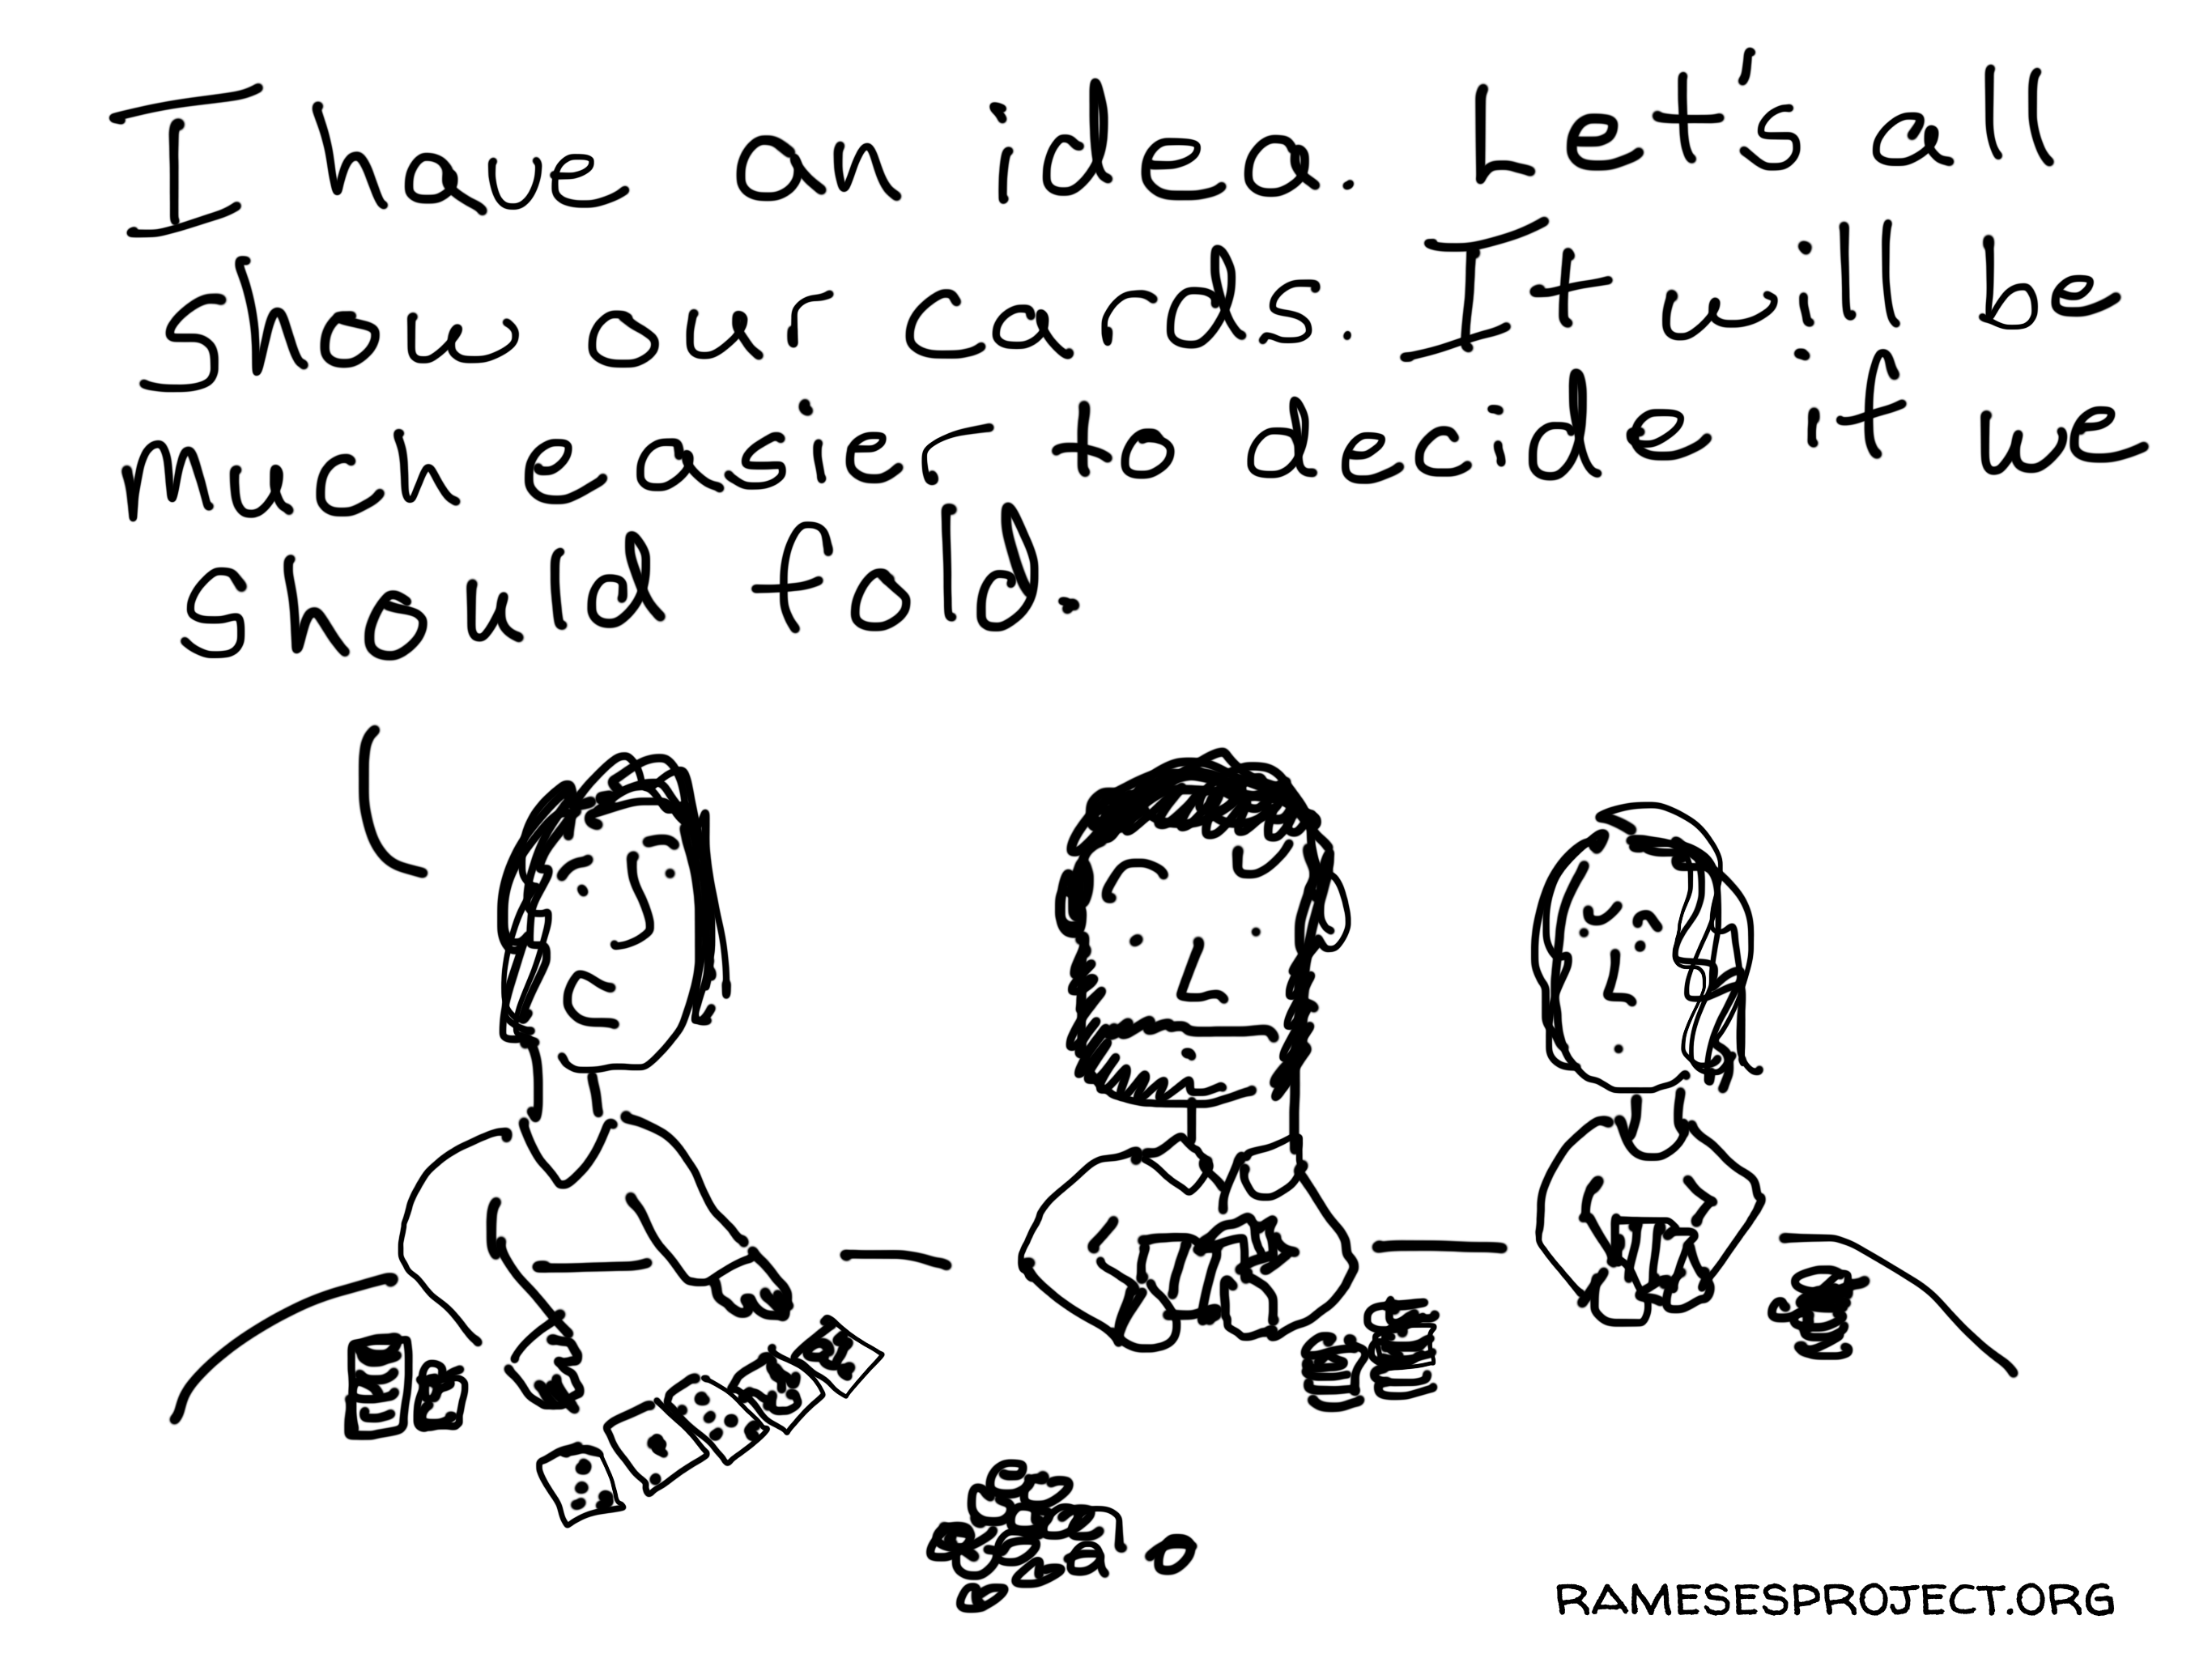
Show your cards
Over the next couple of weeks, I’ll be sharing 10 of the cartoons I created for the Rameses Project on realist evaluation. Visit that site to get access to the full collection. If you’re at all interested in the illustration process I follow when drawing cartoons like these, I wrote about it at Lysydesign.
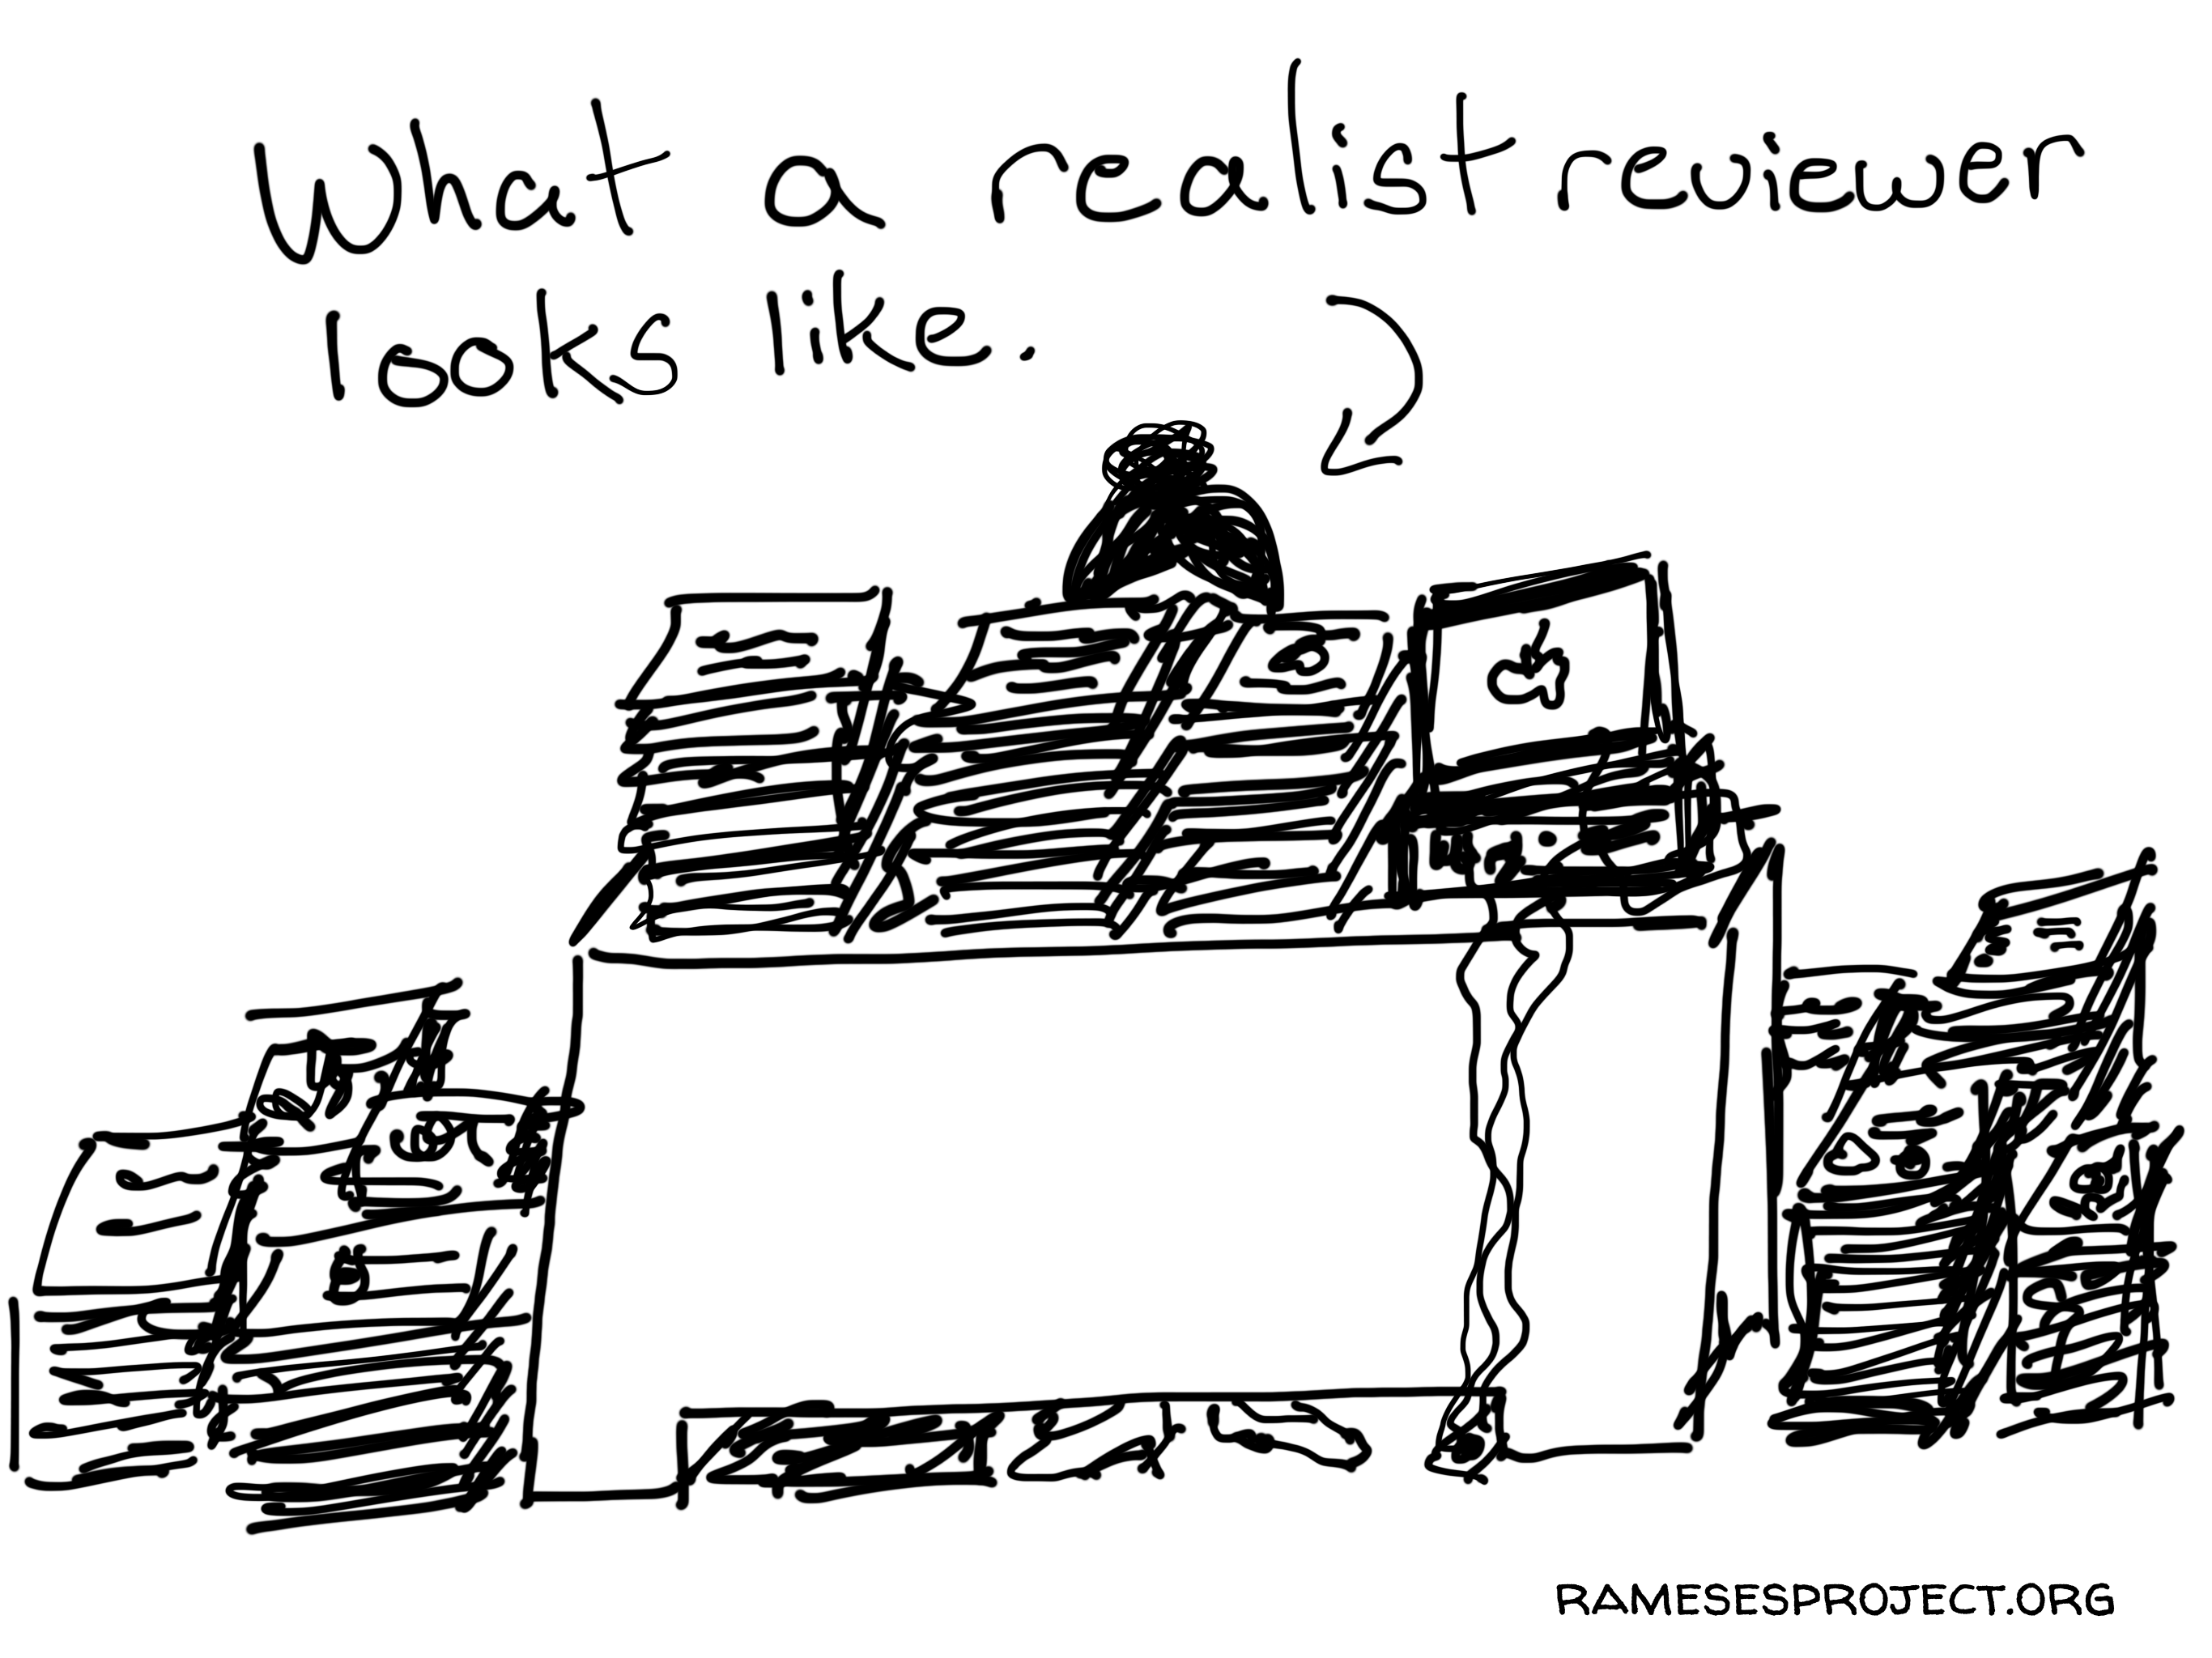
Realist Reviewer
Over the next couple of weeks, I’ll be sharing 10 of the cartoons I created for the Rameses Project on realist evaluation. Visit that site to get access to the full collection. If you’re at all interested in the illustration process I follow when drawing cartoons like these, I wrote about it at Lysydesign.
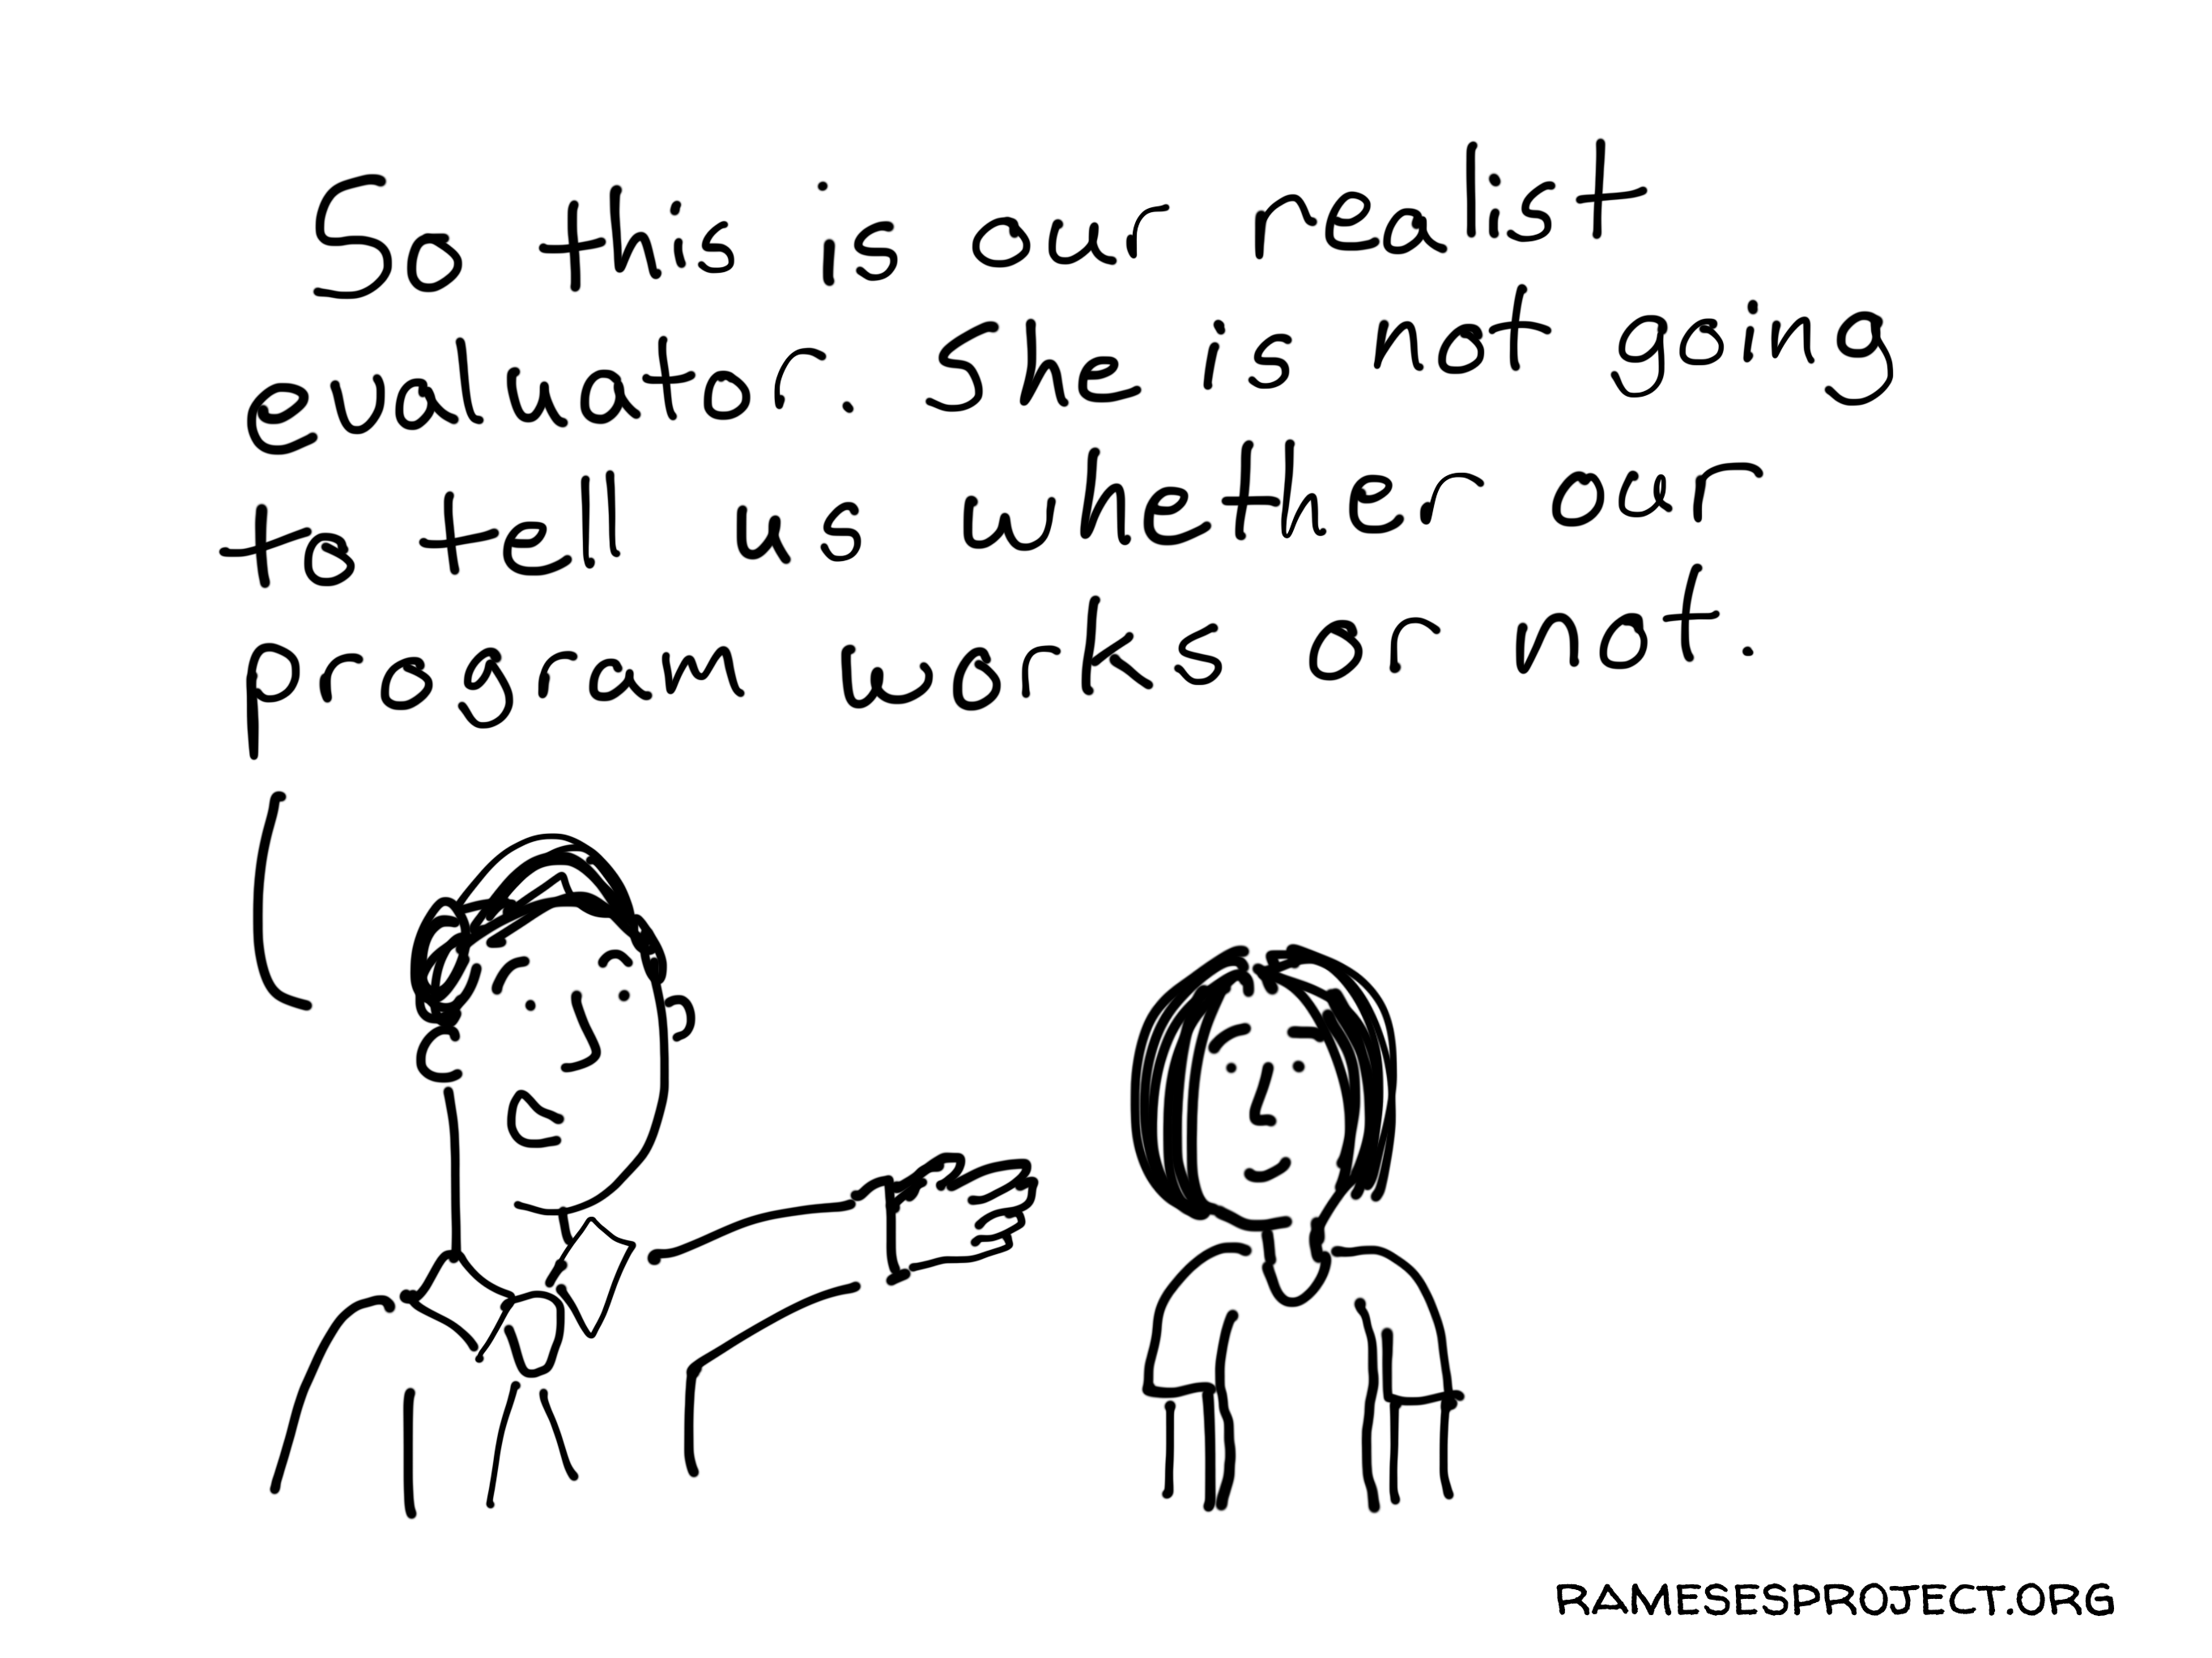
Does it Work?
Over the next couple of weeks, I’ll be sharing 10 of the cartoons I created for the Rameses Project on realist evaluation. Visit that site to get access to the full collection. If you’re at all interested in the illustration process I follow when drawing cartoons like these, I wrote about it at Lysydesign.

Pretty Maps with Adobe Illustrator
This week on Thursday, September 7th at 3 PM EDT, I’ll be holding a webinar on prototyping. This is part of a new series of free webinars I’ll be launching on Data Design Tools & Tactics Webinar Series. Registration is limited to 50 (but I’ll be reserving an additional 50 spots exclusively for members of […]
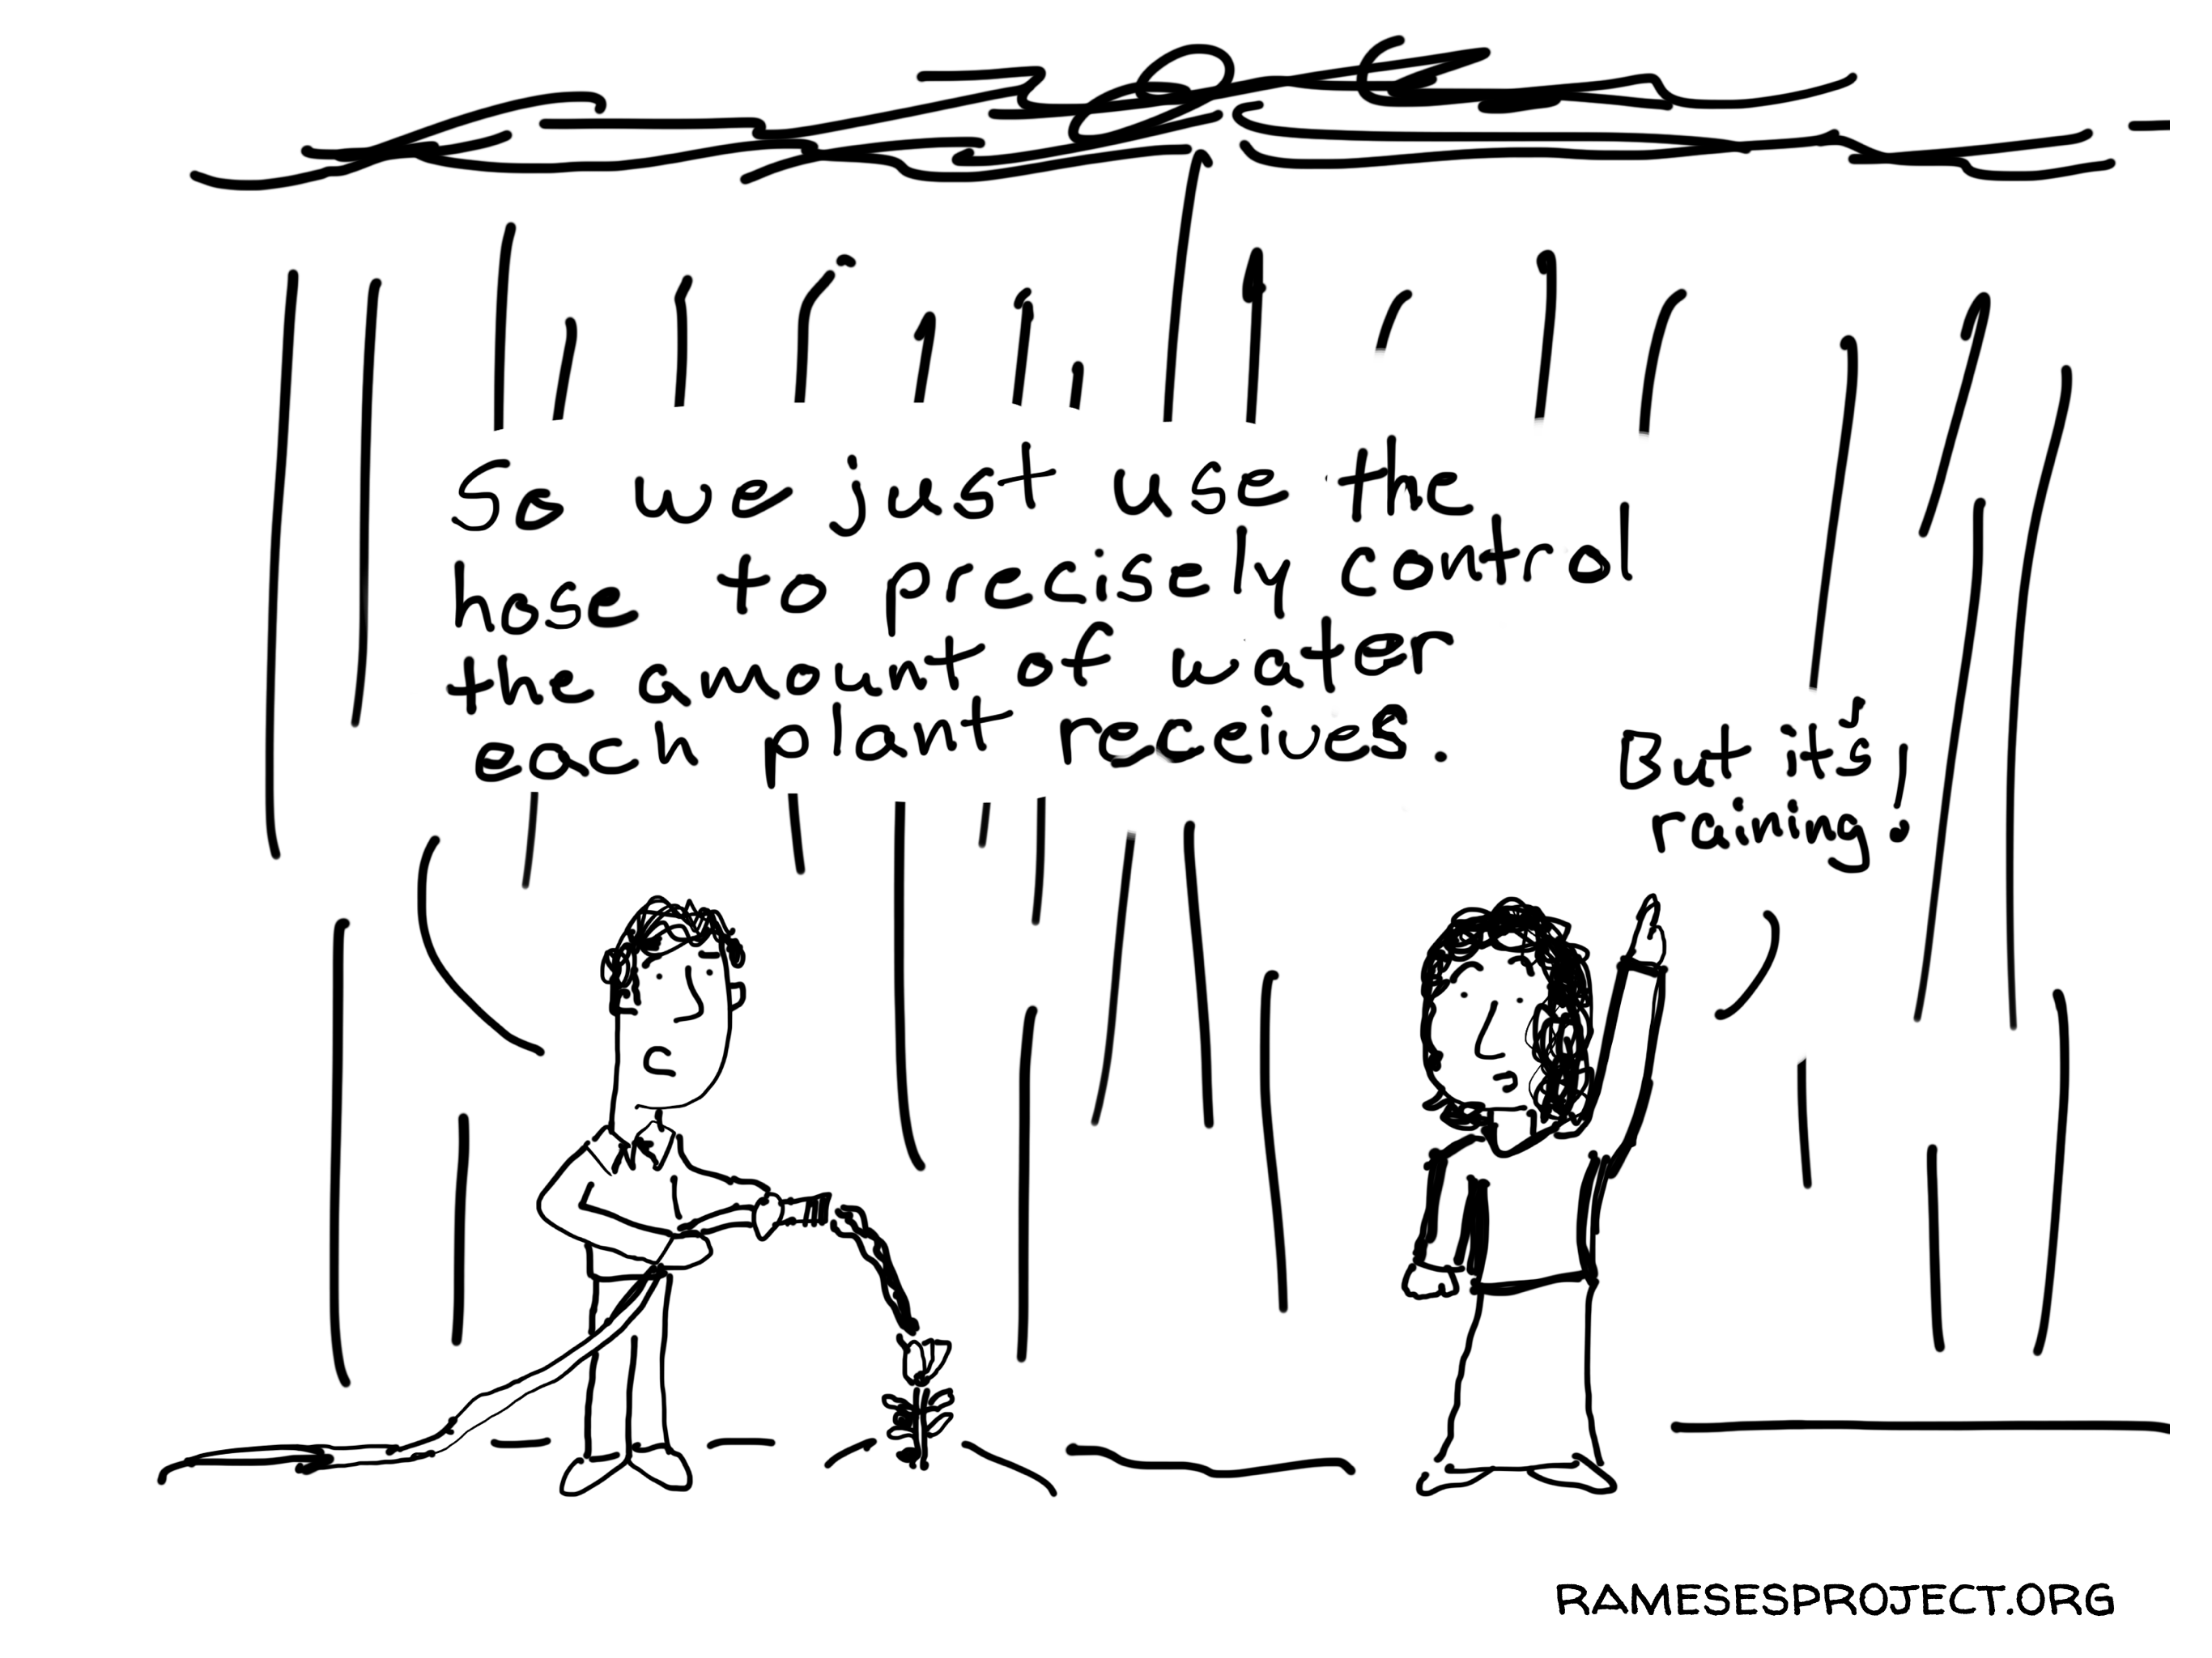
Controlling the Treatment Dosage
Over the next couple of weeks, I’ll be sharing 10 of the cartoons I created for the Rameses Project on realist evaluation. Visit that site to get access to the full collection. If you’re at all interested in the illustration process I follow when drawing cartoons like these, I wrote about it at Lysydesign.

Crystal Ball Evaluator
Over the next couple of weeks, I’ll be sharing 10 of the cartoons I created for the Rameses Project on realist evaluation. Visit that site to get access to the full collection. If you’re at all interested in the illustration process I follow when drawing cartoons like these, I wrote about it at Lysydesign.

But why is the swan black?
It’s the difference between is this true, is this false, and is this interesting. Over the next couple of weeks, I’ll be sharing 10 of the cartoons I created for the Rameses Project on realist evaluation. Visit that site to get access to the full collection. If you’re at all interested in the illustration process I follow […]
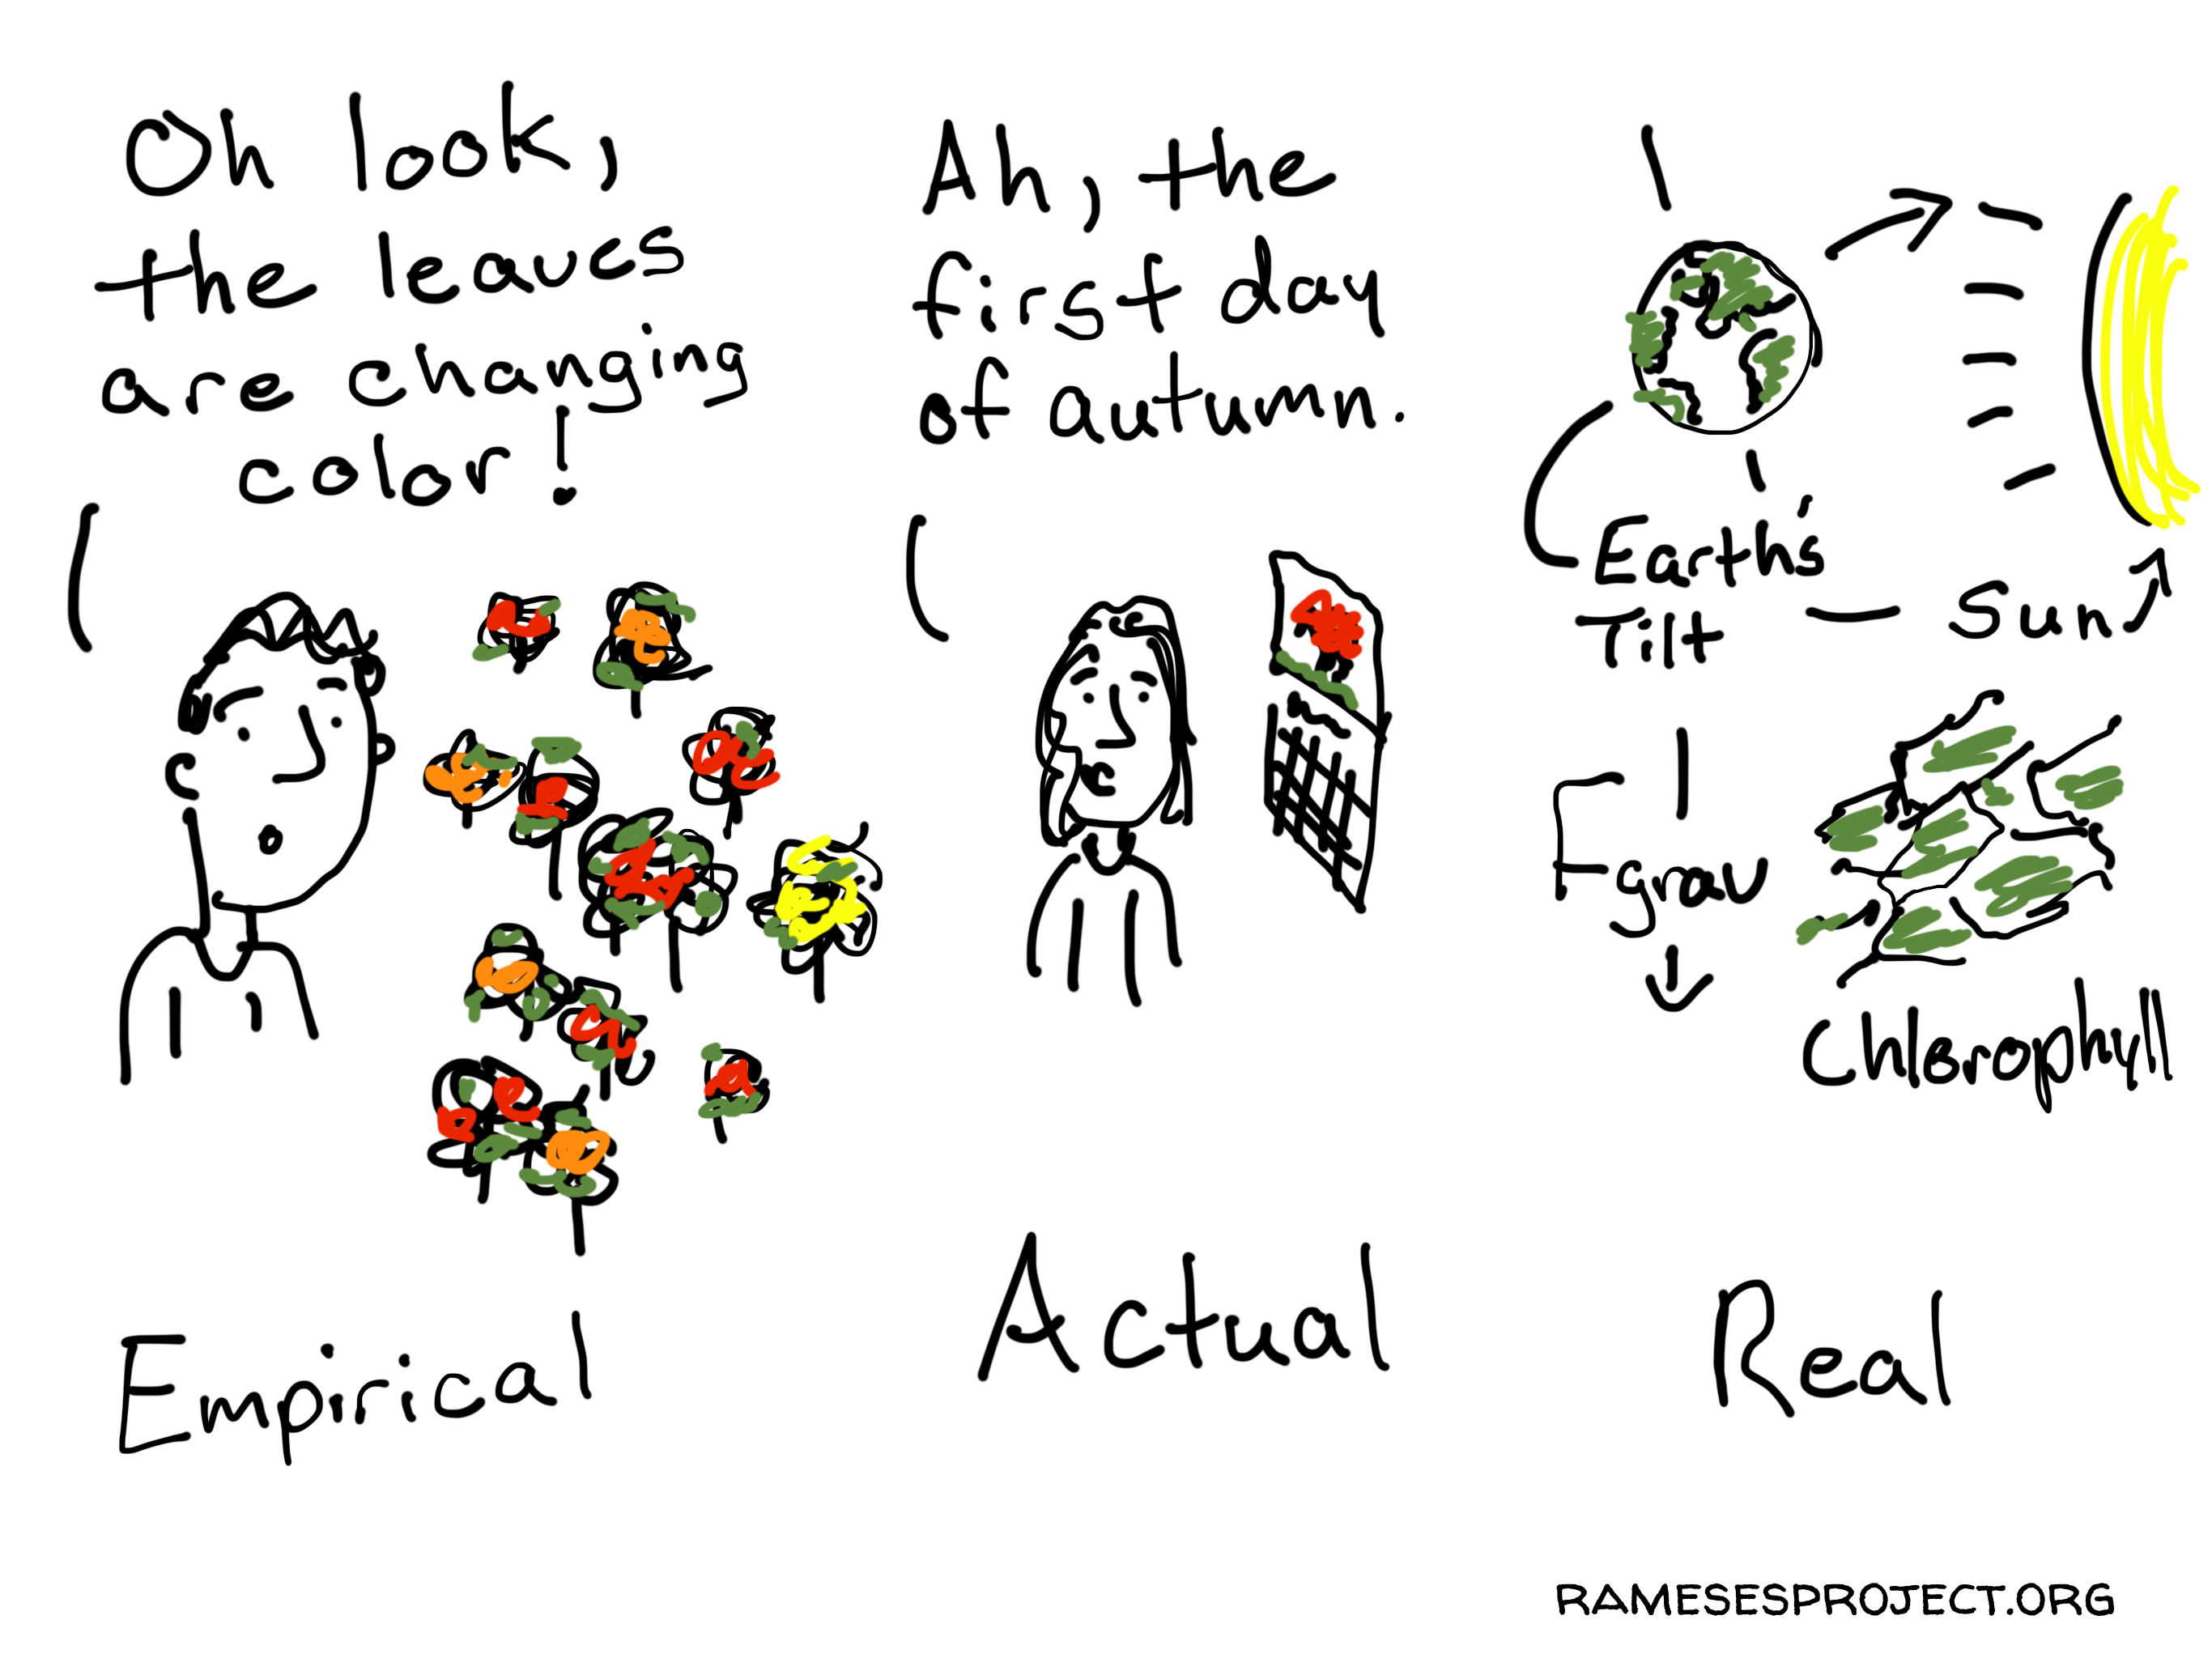
Empirical Actual Real
I had to tweak this cartoon, originally it said the “first day of fall.” Over the next couple of weeks, I’ll be sharing 10 of the cartoons I created for the Rameses Project on realist evaluation. Visit that site to get access to the full collection. If you’re at all interested in the illustration process I follow […]