

When I started drawing comics, back in the early 2010s, there were these really popular animations …
Main Content

Flash forward a few years and I was also designing online courses, producing videos, illustrating reports, and building learning communities.
Teaching myself design created so many opportunities that led to new positions, promotions, and, eventually, a successful independent consulting business.
And what I’ve learned teaching this creative stuff to other data people, is that it doesn’t just work for me. It can work for you too.


From the blog
Who is the Hero? Storytelling Methods for Data People.
Good stories always have heroes, even data stories. So who is the hero in your story? So …
Continue Reading about Who is the Hero? Storytelling Methods for Data People. →
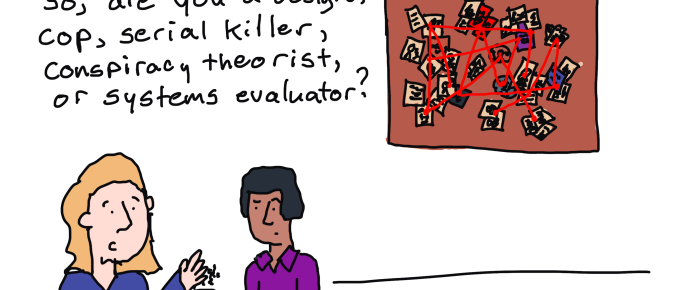
128 Evaluation Cartoons for Presentations and Blog Posts
Looking for an evaluation related cartoon for your next presentation or blog post? Well, over the …
Continue Reading about 128 Evaluation Cartoons for Presentations and Blog Posts →

What is Card Sorting? UX Methods for Data People
Card sorting is a user experience research method useful in discovering how people organize and …
Continue Reading about What is Card Sorting? UX Methods for Data People →

How to become a data designer.
Ever wonder why some data teams deliver really nice looking reports while others seem like they're …

How to create a scatterplot in Canva!
The scatterplot is one of my favorite graph types. So how do you create one in Canva? Just an …
Continue Reading about How to create a scatterplot in Canva! →

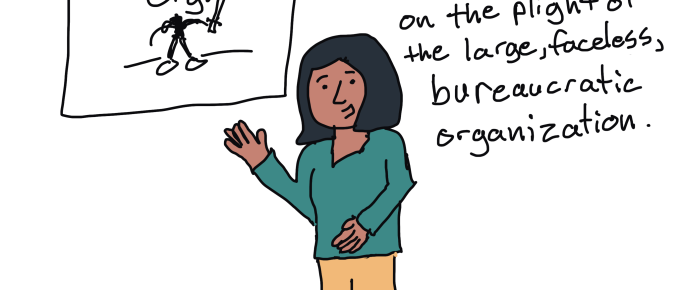
My Cartoon Illustration Process – Realist Evaluation Comics
Back in 2017 I was commissioned by the RAMESES II project (funded by *NIHR) to draw a series of …
Continue Reading about My Cartoon Illustration Process – Realist Evaluation Comics →

Evaluation versus Monitoring
Today's post started as a comic request and turned into a Q&A. Here is the question that came …

Canva Templates – Inspired by the Nature Conservancy
Trying out a new series this week. The idea is simple, I find some inspiration and then use that …
Continue Reading about Canva Templates – Inspired by the Nature Conservancy →

Evaluation Ethics Fails, 8 illustrations
I'm sick this week, so instead of writing something new, I thought I republish something valuable …
Continue Reading about Evaluation Ethics Fails, 8 illustrations →

Building Your Creativity Toolkit
“Creativity is not a talent. It is a way of operating” These are words that came from comedy …

5 Baby Steps to Better Reports
A couple of years ago I put out a book called the Reporting Revolution. And while I still believe …